Explore 90+ Free Plugins for WordPress
Why you should think about integrating the Graphs and Charts plugin on your WordPress site
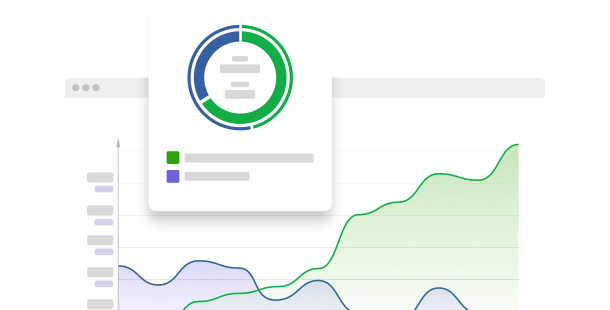
Through the use of the WordPress Graphs and Charts plugin, you can improve your website by visually representing data in a clear and interesting manner. With this data visualization tool, you can change complex information into simple graphs and charts, helping in better communication with your audience and promoting data-driven choices.
Here are some reasons why you should consider incorporating this interactive chart interface to your WordPress site:
- Enhance user understanding with visual data presentations. Set up a data visualizer to show data through various graph styles like bar, line, and pie charts, facilitating for users to comprehend and engage with your content.
- Upgrade report and analysis posts. Use a data plotter to provide visual summaries of reports, enhancing the legibility and attractiveness of analytical content.
- Interactive elements for greater understanding. Utilize an interactive graphics tool to allow users to interact with the data, such as mousing over for more details or selecting to access other sections, providing a more engaging user experience.
Many amazing settings and options are in the pipeline for the Graphs and Charts plugin for WordPress
Our team of developers is constantly working to enhance the Graphs and Charts plugin. Soon, you’ll have entry to more advanced tools and features that will enable you to create even more dynamic and personalizable data visualizations.
Here are some main features:
- Sophisticated personalization settings for colors, labels, and tooltips
- Support for instant data updates within charts
- Feature to upload data from different formats and sources
- Responsive designs that adjust to display size for best viewing on any device
Visualize complex data efficiently with the WordPress Graphs and Charts plugin!
How can I integrate the Graphs and Charts plugin into my WordPress website?
Integrating the Graphs and Charts plugin on your WordPress site is straightforward with our no-code solution. The plugin can be smoothly incorporated across your site to improve your content with informative and visually pleasing data visualizations.
- Use our configurator to tailor your own code-free plugin.
Choose the types of graphs and charts that best suit your data presentation needs and adjust your preferences. - receive your personalized integration code from our platform’s interface.
After setting up, copy the code presented in the popup and save it for future use. - Commence the embedding of the plugin on your WordPress site.
Insert the copied code into your page’s HTML and make the changes. - Completed! The embedding of your no-code plugin is now live.
Visit your site to see how the new interactive chart interface upgrades the visualization and understanding of your data.
If you experience any issues during the installation process, our customer support team is prepared to assist you with any challenges related to the integration of the Graphs and Charts plugin.


