Explore 90+ Free Widgets for Elementor
Why you should think about integrating the Graphs and Charts plugin on your Elementor site
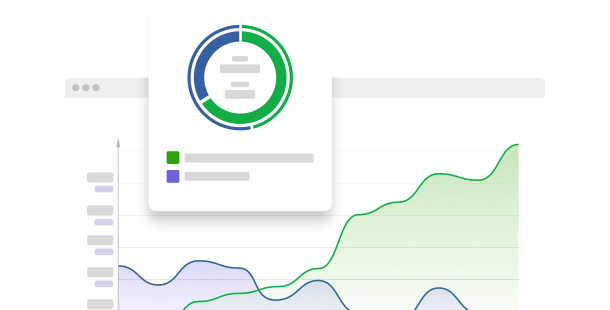
Through the use of the Elementor Graphs and Charts plugin, you can enhance your website by showing data in an understandable and captivating manner. With this data visualization tool, you can convert complicated information into comprehensible graphs and charts, aiding in better interaction with your audience and promoting data-driven decision-making processes.
Here are some benefits why you should think about incorporating this interactive chart interface to your Elementor site:
- Boost user comprehension with graphical data displays. Deploy a chart creator to illustrate data through various graph styles like bar, line, and pie charts, making it easier for users to comprehend and engage with your content.
- Improve analytical reports. Use a data plotter to give graphical overviews of reports, improving the clarity and engagement of analytical content.
- Interactive elements for more engagement. Use an interactive graphics tool to allow users to explore the data, such as hovering over for more details or clicking to view other sections, providing a more interactive user experience.
A variety of great features and settings are on the way for the Graphs and Charts plugin for Elementor
Our developers are actively endeavoring to upgrade the Graphs and Charts plugin. Soon, you’ll have access to more sophisticated tools and capabilities that will enable you to design even more interactive and customizable data visualizations.
Here are some notable features:
- Enhanced personalization settings for colors, labels, and tooltips
- Support for real-time data updates within charts
- Option to upload data from various formats and sources
- Adaptive layouts that adjust to device size for best viewing on any device
Display intricate data effectively with the Elementor Graphs and Charts plugin!
How can I install the Graphs and Charts plugin into my Elementor website?
Integrating the Graphs and Charts plugin on your Elementor site is simple with our zero-code solution. The plugin can be seamlessly incorporated across your site to improve your content with engaging and visually pleasing data visualizations.
- Use our setup tool to customize your own zero-code plugin.
Select the types of graphs and charts that best match your data presentation needs and set your preferences. - receive your personalized HTML code from our platform’s interface.
After configuring, copy the code shown in the popup and save it for later use. - Commence the integration of the plugin on your Elementor site.
Place the previously saved code into your site’s HTML and make the changes. - Completed! The installation of your zero-code plugin is now enabled.
Visit your site to see how the new interactive chart interface upgrades the display and grasp of your data.
If you face any problems during the integration process, our customer support team is available to assist you with any challenges related to the integration of the Graphs and Charts plugin.