Explore 90+ Free Widgets for iFrame
Why you should ponder integrating the Graphs and Charts plugin on your iFrame site
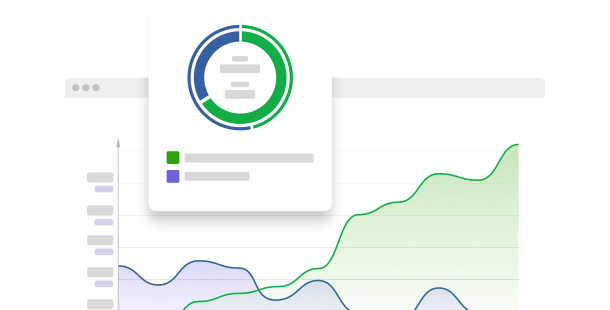
Through the use of the iFrame Graphs and Charts plugin, you can upgrade your website by displaying data in a clear and interesting manner. With this data visualization tool, you can convert complex information into simple graphs and charts, aiding in better interaction with your audience and supporting data-driven choices.
Here are some advantages why you should think about including this interactive chart interface to your iFrame site:
- Improve user understanding with visual data presentations. Install a data visualizer to show data through various graph styles like bar, line, and pie charts, facilitating for users to comprehend and connect with your content.
- Improve data-driven articles. Use a graph maker to offer graphical overviews of reports, improving the clarity and attractiveness of data-rich posts.
- Interactive elements for deeper insights. Employ an infographic toolkit to allow users to interact with the data, such as hovering over for more details or tapping to access other sections, giving a more interactive user experience.
A variety of fantastic features and features are on the way for the Graphs and Charts plugin for iFrame
Our team of developers is constantly striving to enhance the Graphs and Charts plugin. Soon, you’ll have access to more sophisticated tools and features that will enable you to design even more interactive and customizable data visualizations.
Here are some notable features:
- Advanced adjustment features for colors, labels, and tooltips
- Support for live data updates within charts
- Feature to integrate data from different formats and sources
- Responsive designs that adjust to device size for ideal viewing on any device
Display intricate data effectively with the iFrame Graphs and Charts plugin!
How can I integrate the Graphs and Charts plugin into my iFrame website?
Installing the Graphs and Charts plugin on your iFrame site is easy with our zero-code solution. The plugin can be smoothly integrated across your site to upgrade your content with informative and visually pleasing data visualizations.
- Use our customization tool to tailor your own code-free plugin.
Choose the types of graphs and charts that best suit your data presentation needs and configure your preferences. - Obtain your personalized integration code from our platform’s interface.
After configuring, copy the code presented in the popup and save it for future use. - Begin the integration of the plugin on your iFrame site.
Insert the previously saved code into your site’s HTML and make the changes. - Completed! The integration of your zero-code plugin is now enabled.
Check your site to see how the new interactive chart interface improves the display and comprehension of your data.
If you encounter any difficulties during the installation process, our help team is ready to aid you with any issues related to the setup of the Graphs and Charts plugin.