What is a developer console?
Developer Console is an embedded development environment with a set of instruments that you can use to build, debug, and test applications right in your browser. It records (or logs) the info associated with a web page, such as network requests, HTML, CSS, JavaScript, warnings and errors. The screenshots of warnings in the Developer Console can be extremely helpful for the Elfsight support team if they are resolving the issue you are having with our widgets.
How to Open Console in Different Browsers
It only takes a few clicks to open the console in whatever browser you are employing, and you can also start it by using shortcuts or hotkeys. In the guide below you will find brief instructions on how to open the console in all the most popular browsers and screenshots of the process.
How to open developer console in Chrome
To open dev panel in Google Chrome, you’ll need to click the three-dots icon in the upper-right-hand corner of the browser window, click More tools where you’ll find Developer Tools in a drop-down list.
One more option is to use Chrome dev tools hotkey: F12 (on Windows/Linux), and Option + ⌘ + J (on macOS).
You’ll see console either at the bottom or on the right of the Chrome page. Select the Console option and start examining your code performance.
Further, as you’ve learned how to open developer console in Chrome, you’ll get acquainted with the process of opening developer tools in different browsers.
Open Opera Developer Tools
You can use Opera console to examine, edit, and debug HTML, CSS, and JavaScript. To work with it, you’ll need to use the following shortcut: Ctrl+Shift+C to open Developer Tools Console or Ctrl+Shift+I to first open developer tools and further select Console.
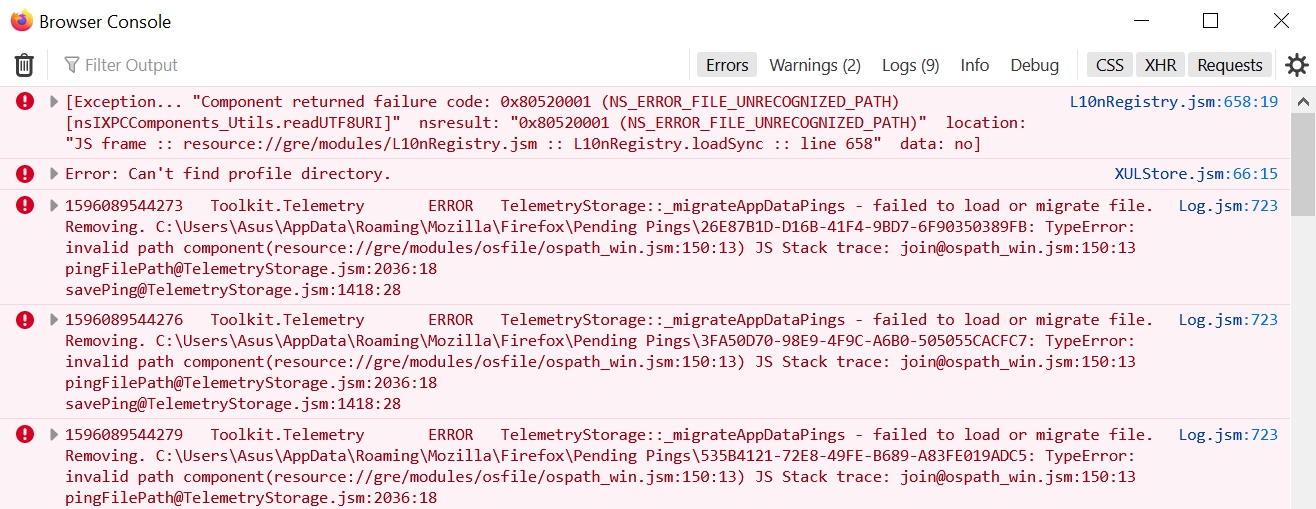
Start Firefox web console
Mozilla console can be initiated by clicking Web Developer in a top-right-hand menu, then, by choosing Browser Console. Also, you may use a Firefox developer tools shortcut, that is Ctrl+Shift+J.
Enable developer tools in Safari
In Safari to open console, you’ll need to enable the Developer Menu. To do that, go to Safari’s preferences (Safari Menu > Preferences) and choose the Advanced Tab.
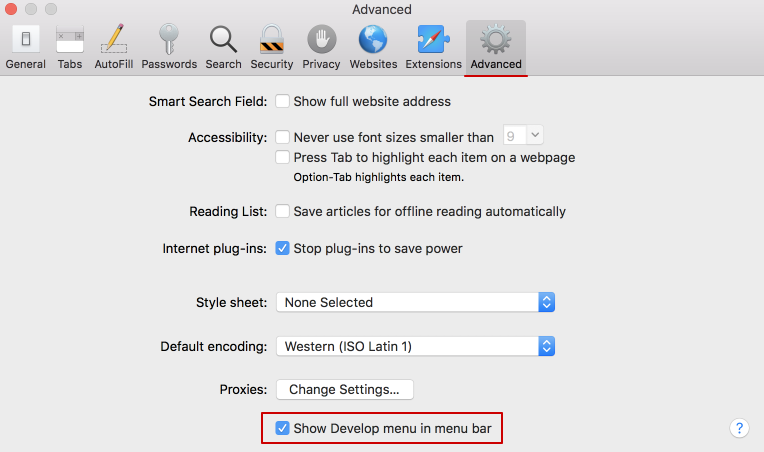
Further, you will open developer console in Safari by clicking on Develop > Show Javascript Console. You can also benefit from the shortcut Option + ⌘ + C. The console tab will open automatically, you will not have to choose it.
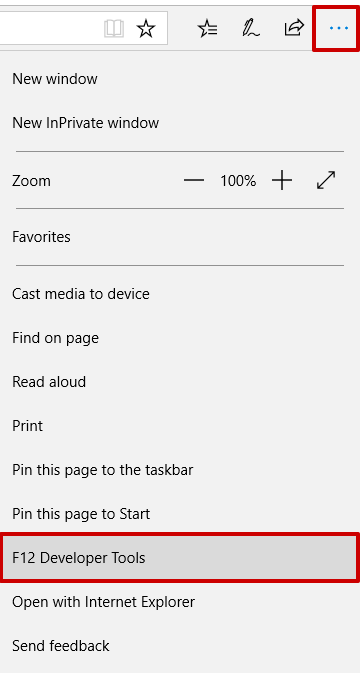
Open Microsoft Edge console
You may open the Edge browser console by clicking on F12 Developer Tools in the dropdown menu, or by pressing F12. You can also right-click on any element of the web page and select Inspect Element.
Open Internet Explorer console
The IE development console can be opened in the same way as the Edge console. Click on F12 Developer Tools in the dropdown menu or just press the F12 key. By doing this, you’ll successfully access the Internet Explorer console and will be able to start examining it.
The main tabs in Developer Tools
Below is a brief overview of the major console tabs located among Developer Tools. We’ve reviewed them all on the example of Google Chrome web browser.
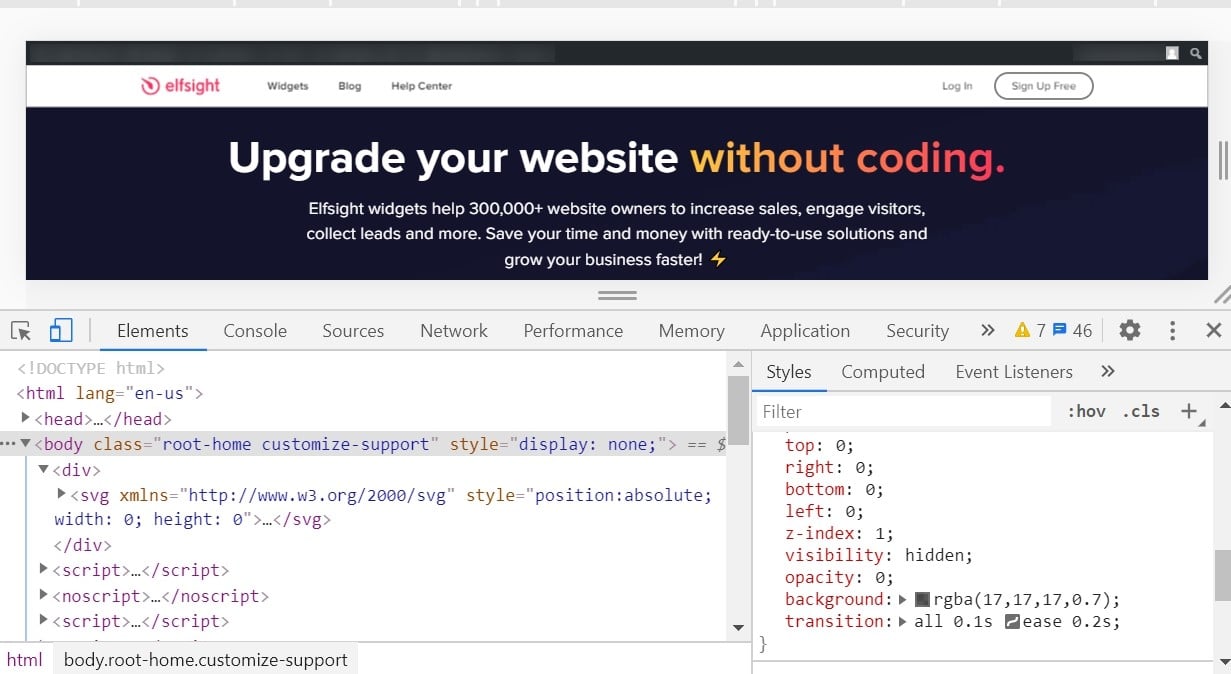
Elements tab
The Elements panel is a great tool for those who want to examine CSS and HTML performance of their web page. You may right-click any element of the page, choose Inspect Element, and see the element’s attributes highlighted in the code.
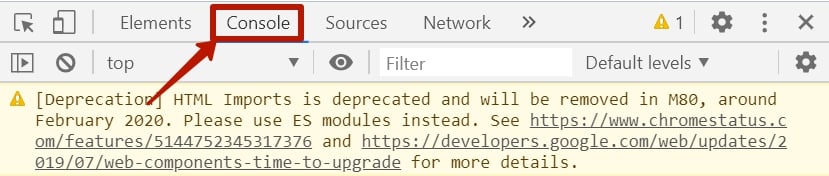
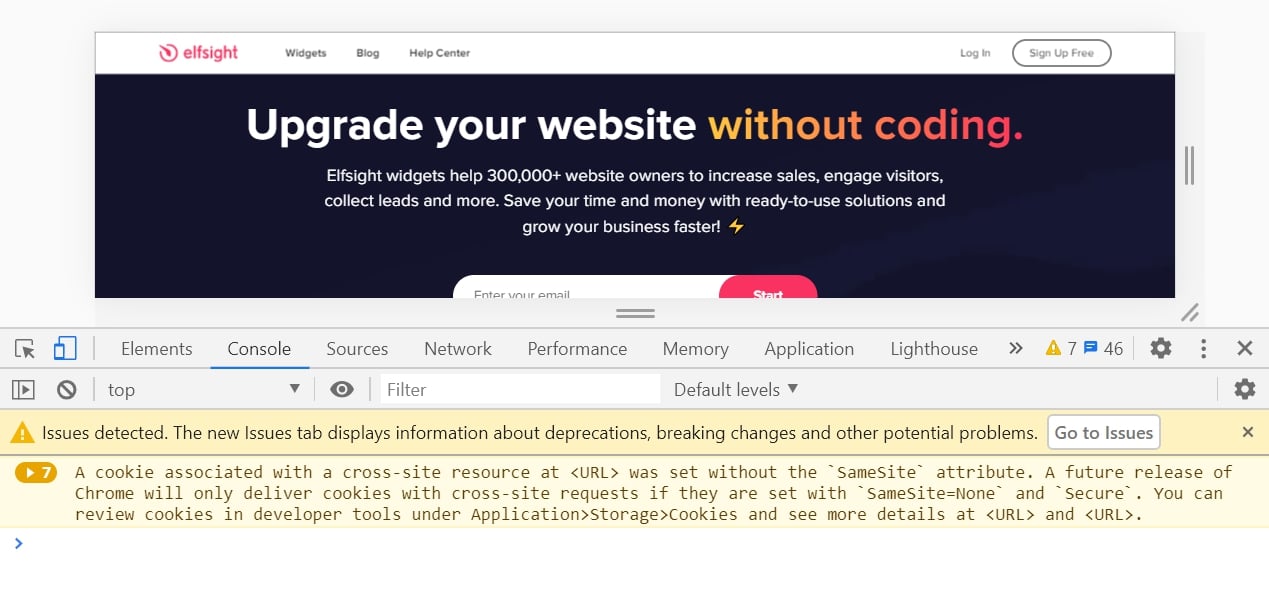
Console
The Console tab in Chrome Developer Tools serves to display the working of scripts on the web page. It is an interpreter of command lines which you can use to start a script engine and enter commands to perform the scripts. If our support team are asking you to take a screenshot of your console, they’ll need a picture made in console tab.
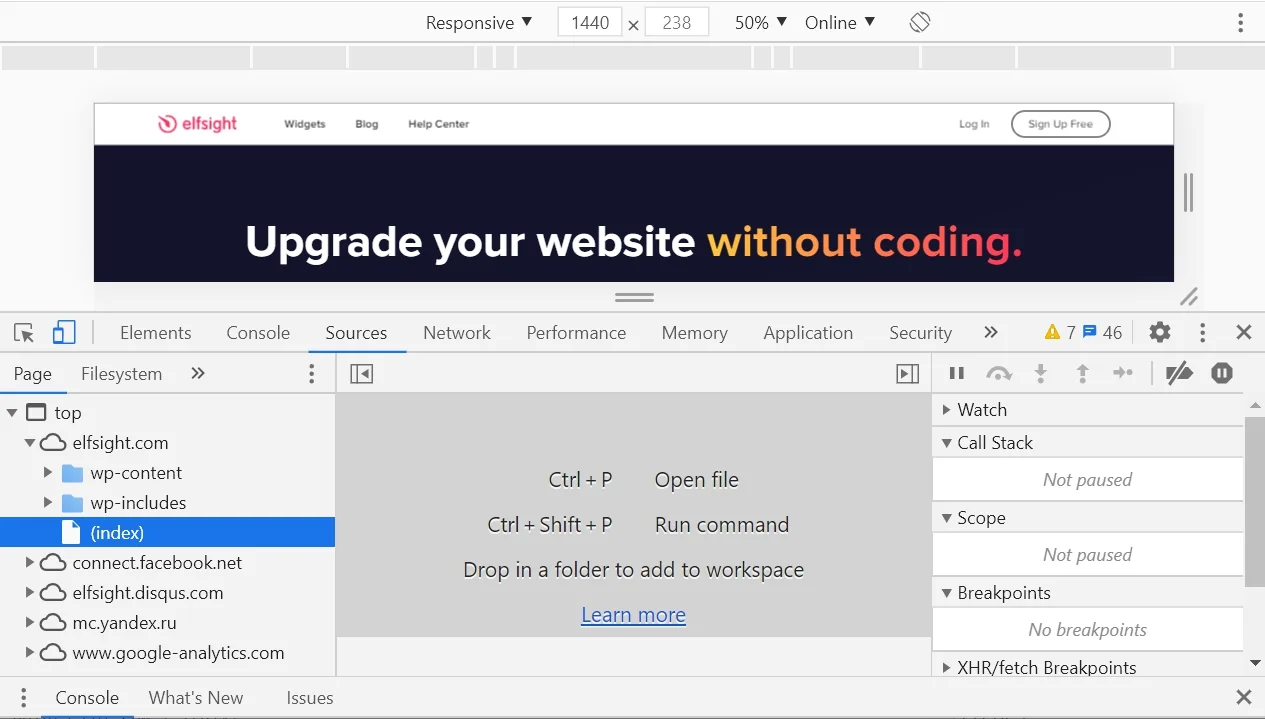
Sources panel
You can utilize the Sources tab in Chrome DevTools to edit JavaScript and CSS, view files, create JavaScript snippets and use them further. Also, this tab may help in debugging JavaScript code.
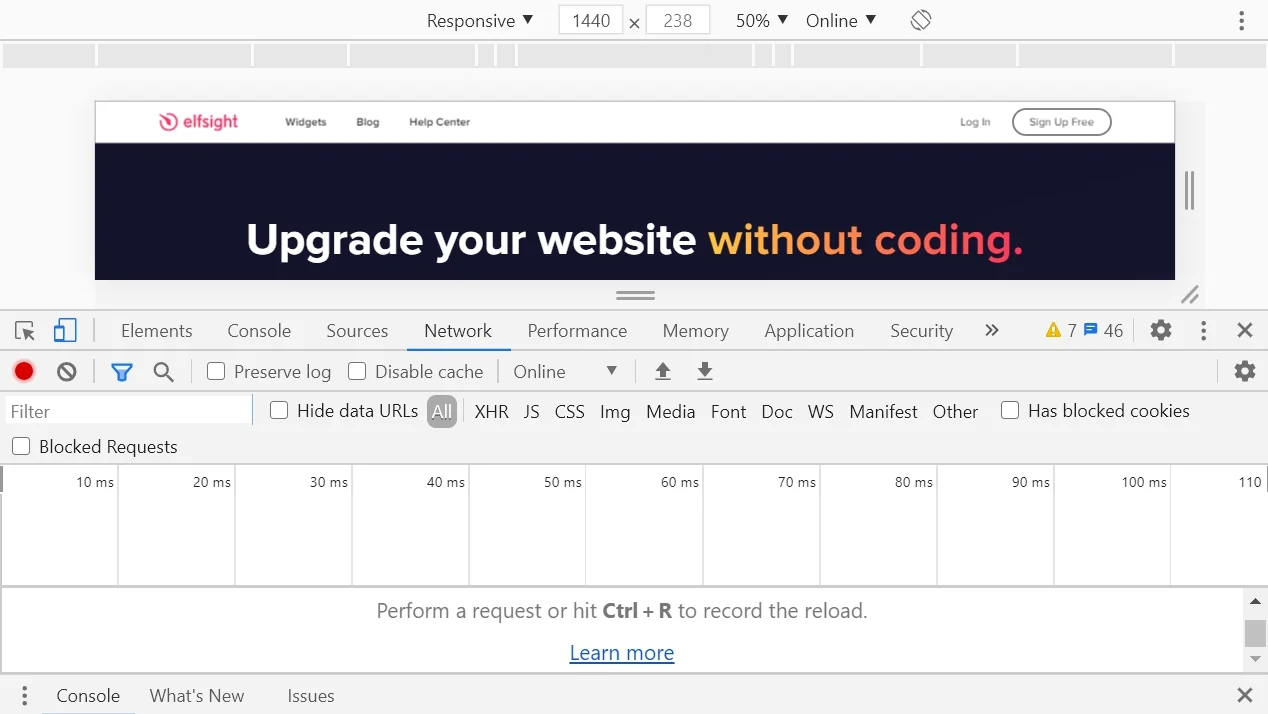
Network tab
The Network pane may be used as a testing tool, which inspects web page performance and recognizes issues that are slowing down the website. The Network tab in Chrome starts recording all network requests once you open DevTools. You can sort them further by different properties.
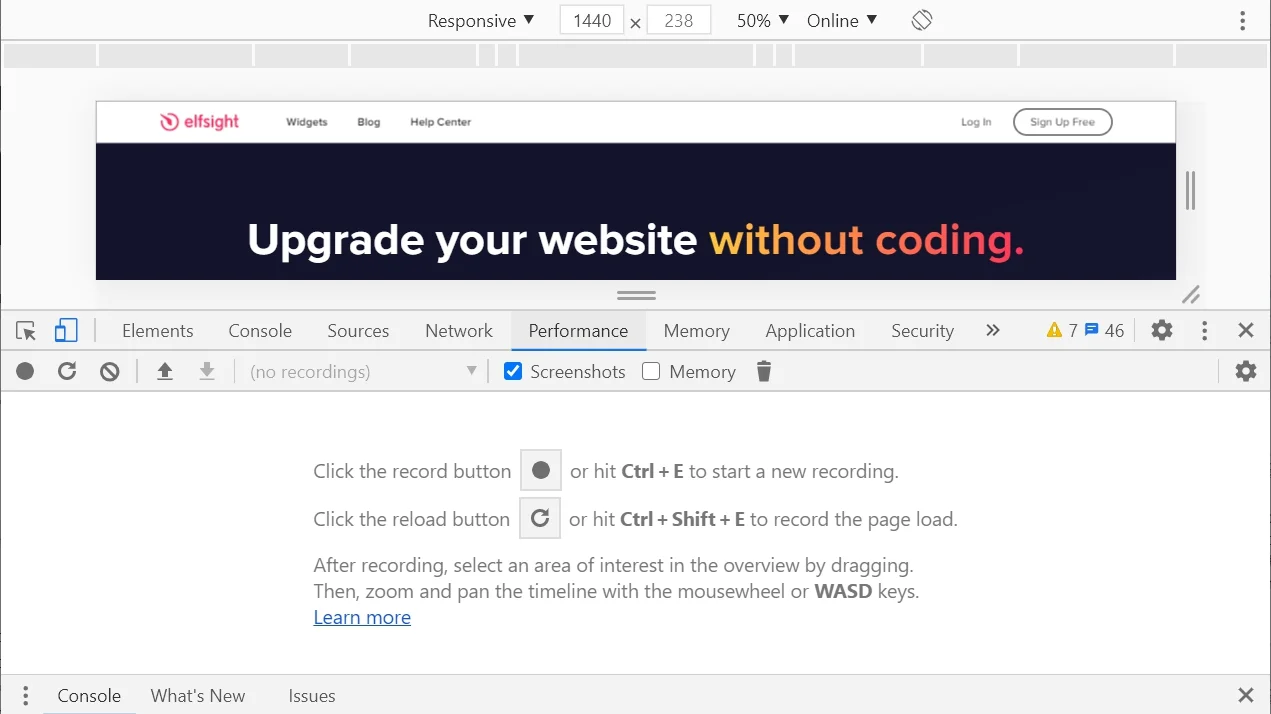
Performance tab
The Performance pane allows you to record the runtime and load performances over time. This panel reveals how well the website acts once it is fully loaded and used by visitors. You can choose to record the performance or take a series of screenshots of the process.
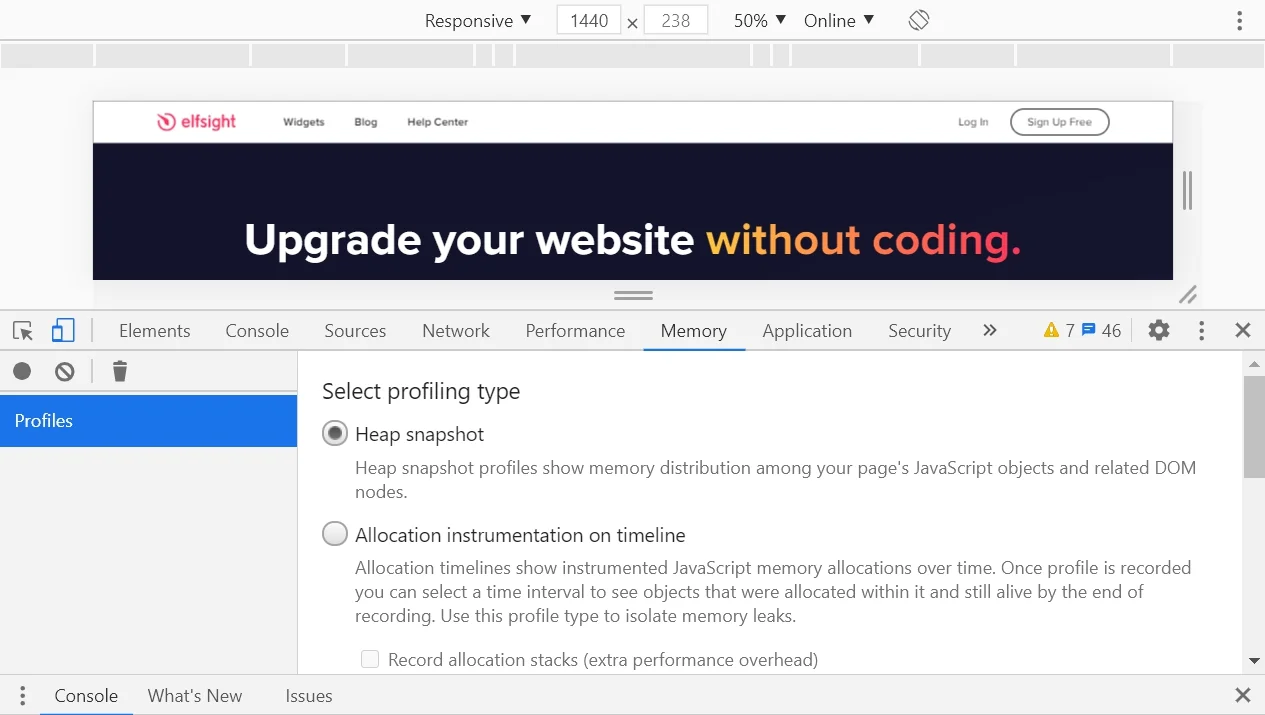
Memory tab
One can use the Chrome Memory tab to diagnose and fix memory issues such as bloating, garbage collection, leaks. All of these problems affect page performance. If these issues are not resolved, your website will become slow and unappealing to visitors.
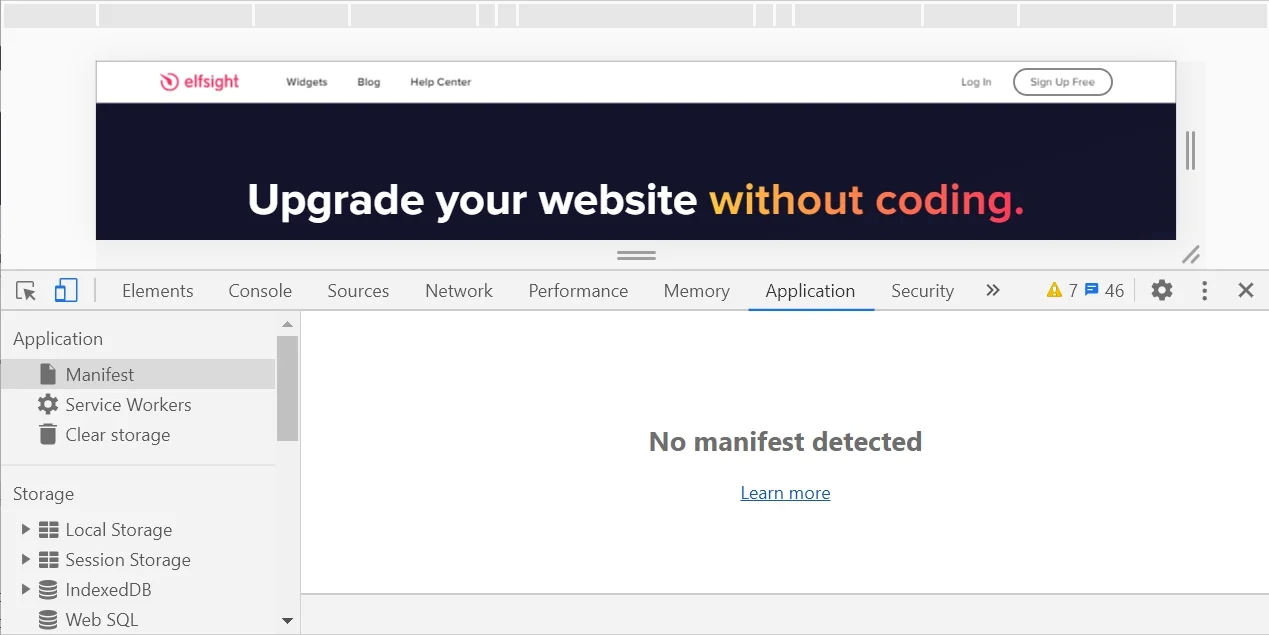
Application panel
With the help of the Application tab you can debug Progressive web apps; inspect and manage storage, databases, and caches; inspect and delete Cookies; and inspect Resources.
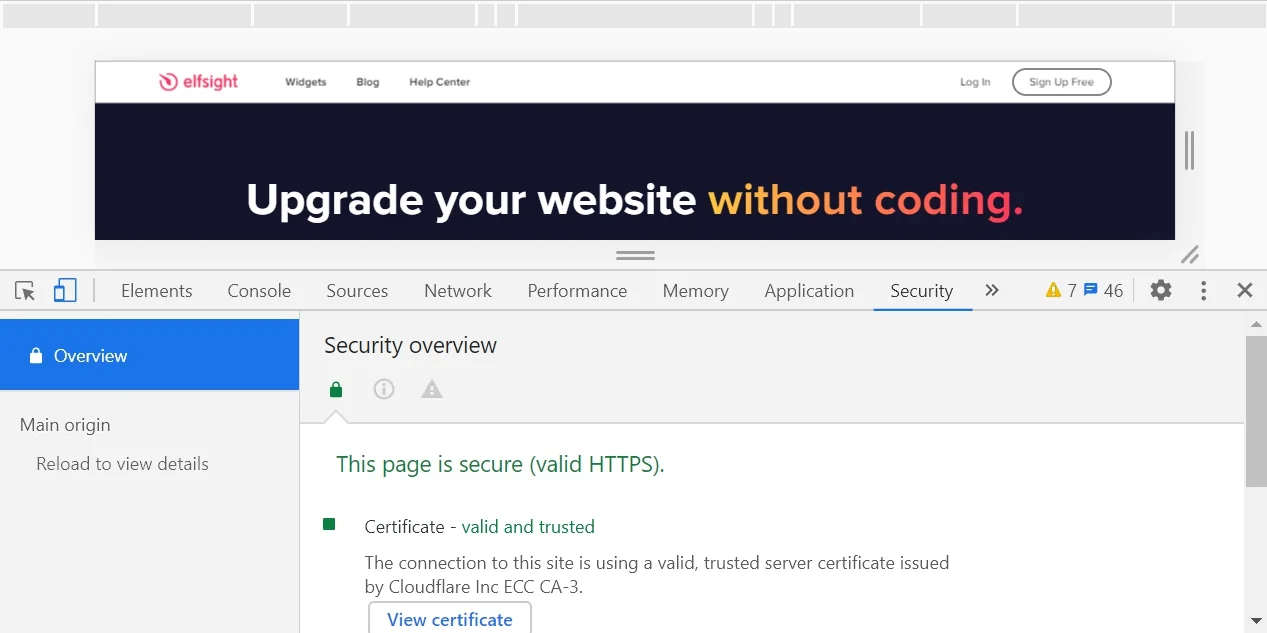
Security
The Security tab can be useful if you want to debug mixed content issues and certificate issues. The website is believed to be insecure when the URL you visited has been requested over HTTP. According to modern web requirements, this should be done via HTTPS protocol. If you see that the page contains mixed content, this means they are partially protected and are vulnerable to sniffers.
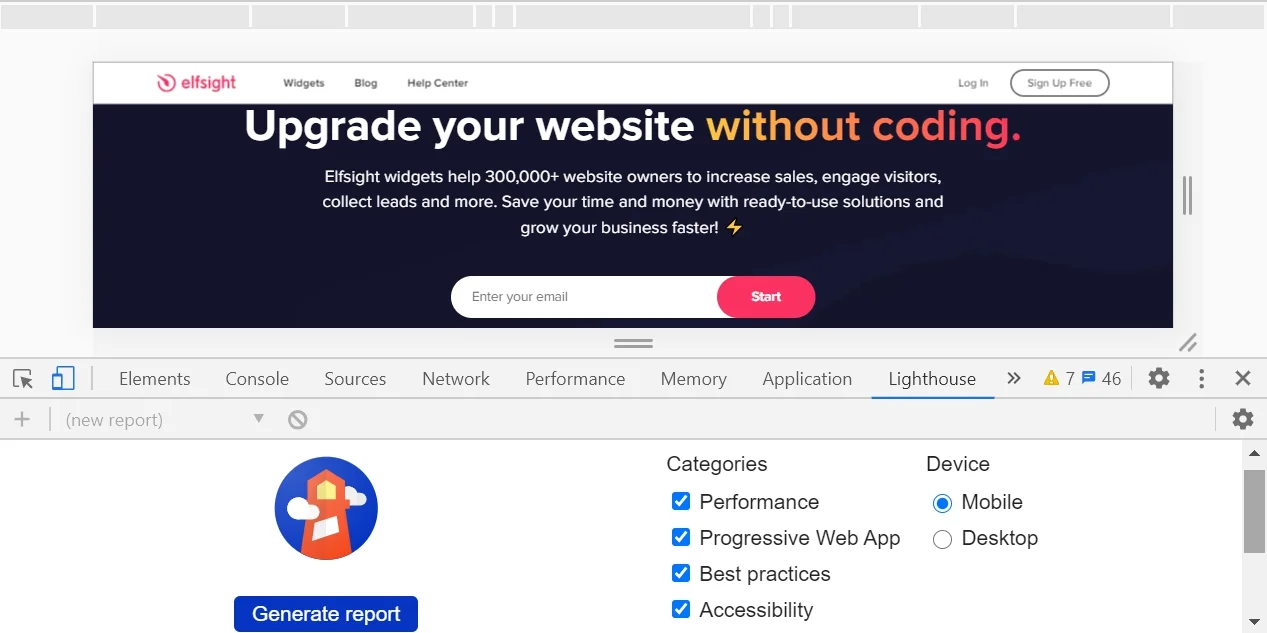
Lighthouse tab
Lighthouse is an automated instrument for improving the quality of web apps. It is directly integrated into Chrome DevTools. It offers performance audits, accessibility, progressive web apps, SEO and more.
Typical console warnings and errors in the work of Elfsight widgets
Sometimes something goes wrong in the work of Elsfight widgets. Don’t be afraid if you see any red colored warnings or errors in the console. If you know the reason why they happened, you can probably fix everything yourself. Below, you’ll find a list of common failures you may see in the console.
These are two errors regarding all our widgets:
WIDGET IS BLOCKED – you have blocked the website domain in your Elfsight account if the error is referred to apps.elfsight.com.
WIDGET NOT FOUND – you might have accidentally deleted the widget in the account. Check it.
See, it’s no big deal. Now, we’ll discuss some errors in the work of particular widgets and integrations.
Google Maps common problems
As for the Google Maps, errors usually occur if something goes wrong with the API key.
ExpiredKeyMapError – the API key has expired or isn’t recognized. In most cases you should generate the new one. If you get this error just after creating a new API key, you’ll need either to wait from 1 to 8 minutes or to separately enable the Places API.
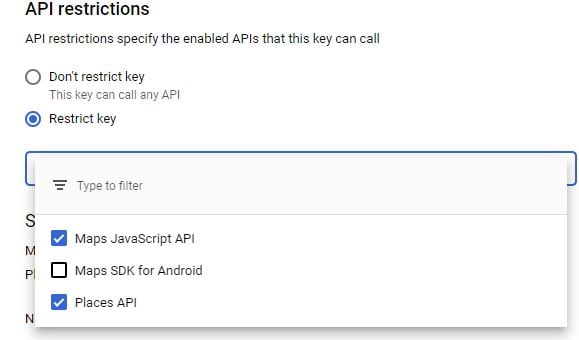
RefererNotAllowedMapError – Elfsight URL loading the Maps JavaScript API hasn’t been allowed to be a referrer. You should check the referrer settings of your API key in the Google Cloud Platform Console. While using our widget, you’ll need to add us as referrer. Here’s an article how to do this correctly.
ClientBillingNotEnabledMapError – For using Google maps widget, you’ll need to have a Billing account. This failure happened because you didn’t activate billing on your project. The solution is to enable billing on the Google Cloud Project associated to this client ID. You may do it here.
BillingNotEnabledMapError – Using Google Maps, you’ll need to enable billing.
YouTube Gallery failures in console
If you use Elfsight YouTube Video Gallery, you will not have to bother about most of the issues listed below. However, there are two general problems that can occur in our widget, too.
quotaExceeded – YouTube uses quotas for people to reach its content and fetch it to websites or applications. Once YouTube quota exceeded, you’ll notice that your YouTube Gallery accidentally stops working or works slowly on the website. The solution may be the following:
- Get a new API key if you are fetching YouTube content yourself;
- Contact our support team at support@elfsight.com if you are using Elfsight YouTube Gallery, which is much easier.
videoNotFound – This warning can occur if the URL you inserted to link to the YouTube video is incorrect. Sometimes users paste a link to the page with the video in it, but it is not the actual location of the video, resulting in the error. Check everything and paste the link to the original video.
Facebook Feed and Instagram Feed Errors
If either Facebook Feed or Instagram has stopped working, you can examine what’s happening in Developer Console. Because both of these popular applications work on the basis of Facebook API, the following explanations of errors may work equally for each of two.
err_ssl_protocol_error when using Facebook or Instagram Feed widget on your website may be caused by various reasons. To resolve it, you can try to set a correct date and time, clear Chrome browsing data or clear your SSL state. Also, if the Facebook Graph API throws errors, you can use the fbtrace_id to find out more info about them. However, if nothing of the above helped, you can always reach out our support team.
rest_cannot_access – usually means that a third-party widget like the Password Protect plugin is preventing our widget from working properly. Disabling such a service will do a trick for you.
The page you requested cannot be displayed right now – this may mean your Facebook application is in development mode. You will not get this error message if you are an Elfsight Facebook Feed user, however, if you see this message, contact our support team.
OAuthException on Instagram in particular means that the login status or access token has been revoked, expired, or is invalid for some reason. In this case, contact our support team, Elfsight developers will get a new access token or look through a subcode, if any.
The most common console errors
Being an experienced web developer, you’ve probably seen these errors more than you wish to. They can be seen in Chrome when you read a property or call a method on an undefined object. You can test try and catch these particular errors in the Chrome and Safari Developer Console.
If you are not a professional programmer, you may omit this guideline.
Uncaught TypeError: Cannot read property
This can happen for many reasons, but the most common is improper state initialization when rendering UI components. This is easy to fix. The simplest way: Initialize state with reasonable default values in the constructor.
TypeError: ‘undefined’ is not an object
This is an error that occurs in Safari when you read a property or call a method on an undefined object. You can test this in the Safari Developer Console. It is practically the same as the above error for Chrome, but Safari uses a different error message.
(unknown): Script error
If you see this error, you should first of all get the real message. You can get it by doing the following: set the Access-Control-Allow-Origin header to * means that the resource can be accessed correctly from any domain. You can replace * with your domain if necessary: for example, Access-Control-Allow-Origin: www.example.org. However, managing multiple domains becomes tricky and may not be worth it if you are using a CDN due to caching issues that can arise.
This is how you should solve the most common JavaScript console errors. We’ll fulfill this list as we and our clients are encounting any other problems.
Conclusion
Developer Console is a great instrument which allows every programmer to get access to tons of data about their website. It’s not very difficult to get open it and start using this tool, however, it will take some time and effort, just be patient.
What errors have you ever come across with? Share your experience in the comments below, we’ll be happy to discuss it with you!
Also, keep in mind that we’ve also got other awesome guides, for example, you can find out how to embed google business reviews on website!