You’ve optimized your website for Google. You’ve built backlinks, refined your meta descriptions, and climbed the search rankings. But here’s the uncomfortable truth: none of that guarantees you’ll show up when someone asks ChatGPT for a recommendation in your industry.
Welcome to the era of AI visibility – a metric that’s quickly becoming as important as your organic search rankings, yet plays by completely different rules.
- Why ranking on Google doesn’t guarantee visibility in AI-generated answers
- The 5 essential KPIs for measuring your brand’s presence in AI-powered search
- How AI visibility tools actually collect data and the biases each method introduces
- A practical sampling framework to measure AI visibility without a statistics degree
- How to interpret variability in LLM outputs and build dashboards that reflect reality
What “AI Visibility” Means (and What to Measure)
Expert Insight:“Whether your content is read, cited or referenced by generative AI, AI visibility is now the first point of influence for many brands. To stay competitive, your content must be built for that visibility.” — Dave Minifie, Terakeet
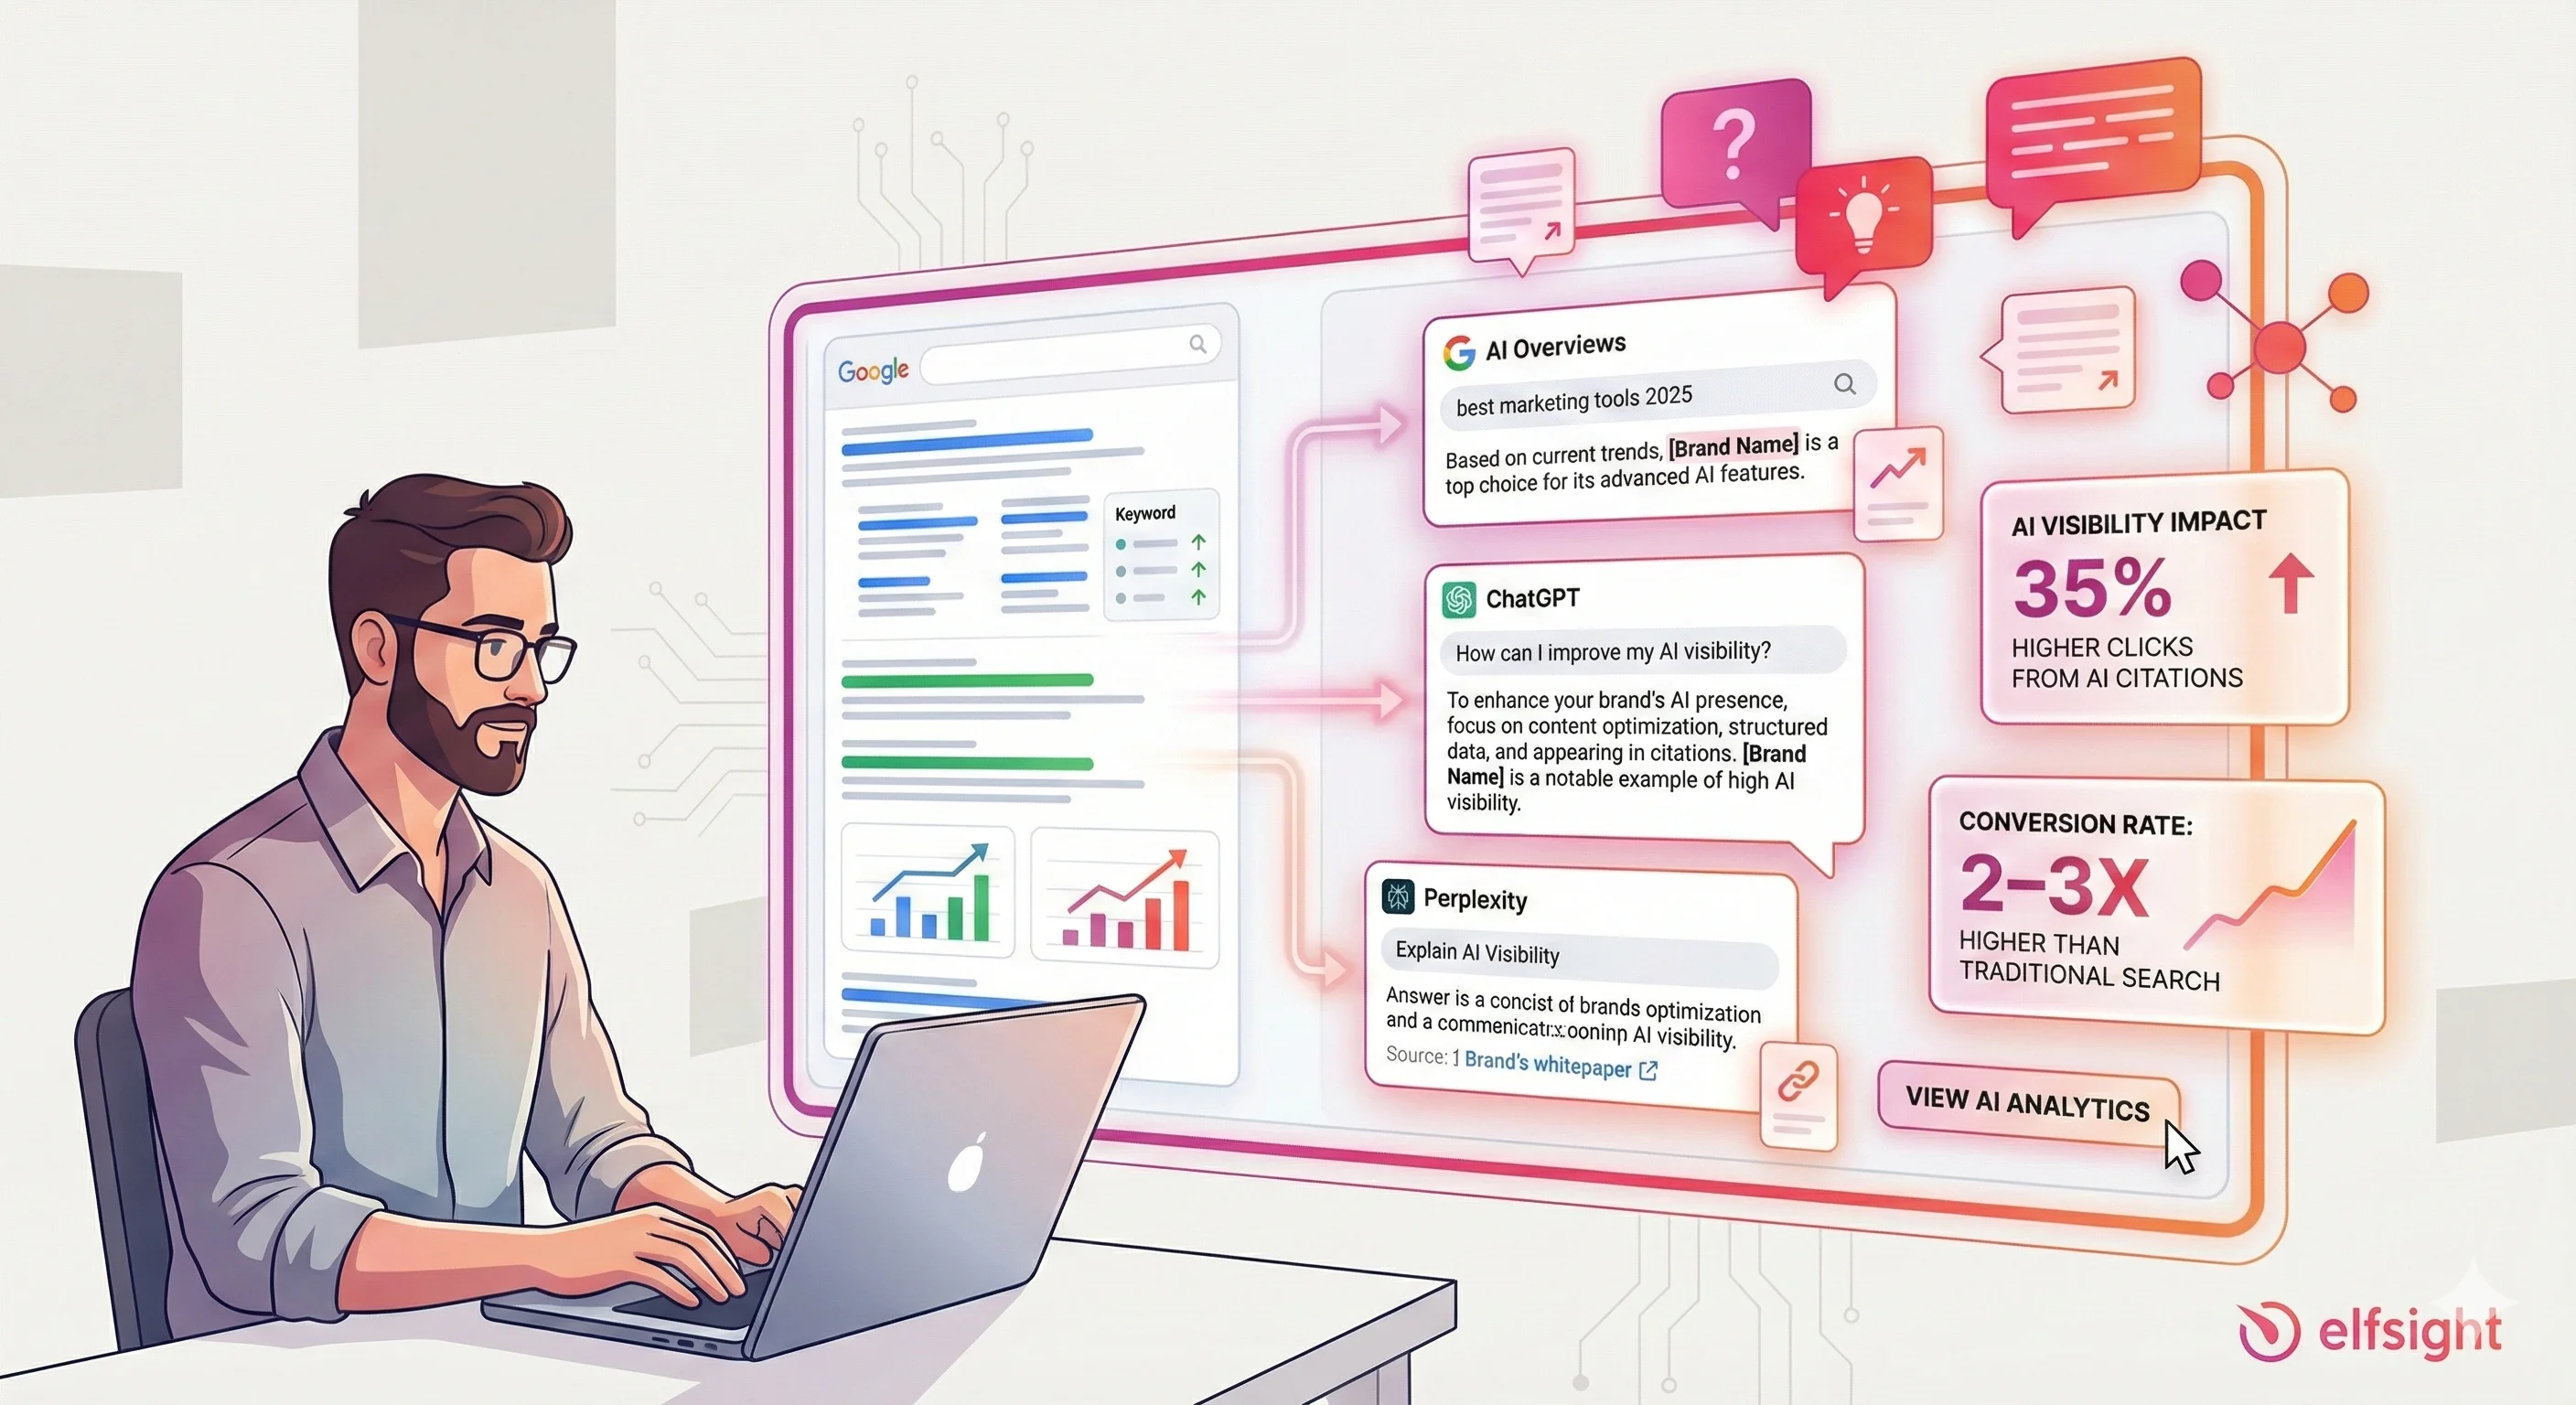
AI visibility measures how discoverable, recognizable, and accurately represented your brand is within AI-powered search tools and large language models. We’re talking about platforms like ChatGPT, Gemini, Claude, Perplexity, and Google AI Overviews. When a consumer asks one of these systems a question related to your industry, AI visibility determines whether your brand appears in the answer—and how it’s portrayed.
The shift happening right now is significant. In 2025, 71% of consumers used AI tools to search, with 14% doing so daily. Brands that appear in these AI-generated answers see measurable impact – pages cited in AI Overviews receive 35% more organic clicks, with AI referrals converting at approximately 2-3x higher rates than traditional search.
That’s why dedicated AI visibility platforms like Beamtrace are emerging – they help teams quantify how often, and in what context, their brand shows up in these AI-generated answers.
So what makes AI visibility different from the metrics you’re already tracking?
📌 What Actually Gets Cited? (The Content Signals)
This is the critical question: if Google ranks don’t predict AI visibility, what does? The answer lies in understanding what content signals AI systems actually reward.
Research analyzing millions of AI citations reveals five dominant signals that separate pages AI chooses to cite from those it ignores.
1. Freshness (Most Critical)
Content cited by AI is 25.7% fresher than content appearing in traditional Google organic search results. This isn’t subtle – it’s a structural preference baked into how AI systems work.
The numbers tell a compelling story:
- ChatGPT cites pages updated in the last 30 days 76.4% of the time
- Gemini shows the strongest freshness preference, with highest density in near-zero-day content
- Perplexity maintains a balanced mix of fresh content (weeks old) and moderately older material (years old)
2. Structure (Highest Direct Impact)
Among all on-page signals, structure is the single strongest predictor of ChatGPT citations.
Research across nearly two million sessions found that answer capsules were present in 86.8% of pages receiving ChatGPT referrals, compared to just 13.2% of pages that had neither an answer capsule nor proprietary insight.
What an answer capsule looks like:
- 1–2 sentence direct answer to the question at the top of the page (before explanation)
- Minimal linking inside the capsule text (external links especially limit extraction)
- Clear, standalone sections that could be quoted without reading surrounding context
Additional structural signals that matter:
- Lists and tables (easier for AI to extract) rank higher than prose paragraphs
- H2 headers breaking content into scannable chunks improve citation odds
- Bullet points with evidence density (data, statistics, citations) extract cleanly
3. Authority & E-E-A-T (Operationalized Differently Than SEO)
E-E-A-T (Experience, Expertise, Authoritativeness, Trustworthiness) still matters for AI, but it manifests differently than in Google search.
What AI systems prioritize:
- Named, visible authors beat faceless corporate pages; author bylines with dedicated author pages significantly boost citations
- Brand search volume (not backlinks) is the #1 predictor of AI citations with 0.334 correlation, stronger than traditional backlinks at 0.37
- Multi-platform presence: Brands present on 4+ online platforms are 2.8x more likely to appear in ChatGPT responses
- Consistency signals: Consistent brand mentions, citations, and entity references across the web increase trust
4. Original or Proprietary Data (Second Strongest Differentiator)
After answer capsules, original data is the strongest predictor of ChatGPT citations.
The impact is substantial:
- Adding statistics increases AI visibility by 22%
- Adding quotations increases visibility by 37%
- Original research, proprietary datasets, or pilot results significantly boost citation odds
5. Evidence Density (Supporting Claims Everywhere)
Passages rich in data, statistics, and citations score higher than general statements or opinion-based content.
AI systems evaluate each potential citation for extractability. A passage that includes corroboration (alignment with multiple reliable sources) and specific data points is far more likely to be quoted than vaguer content.
The structure that wins:
- Specific data points with sources attributed
- Corroborating references (showing agreement across expert sources)
- Real examples over hypothetical ones
- Verifiable claims over aspirational statements
🌐 Platform-Specific Patterns: Why Your Page Strategy Can’t Be One-Size-Fits-All
Here’s a critical insight: ChatGPT, Perplexity, Gemini, and Google AI Overviews each cite different types of content.
ChatGPT relies heavily on training data and Bing web results. It favors technical depth, recent content, and broad-reaching publications. Wikipedia represents ~47.9% of its citations; the platform mentions brands 3.2x more often than it cites them with links.
Perplexity runs real-time searches and favors multi-source answers, giving you more opportunities to appear as one of several cited sources. Reddit leads at 46.7% of citations; the platform prefers recent URLs and smaller, underexploited niches.
Gemini prioritizes brand-owned content and shows the strongest preference for fresh material. It’s most similar to Google search rankings but with different authority weighting.
Google AI Overviews maintain the closest alignment with traditional search rankings: 93.67% cite at least one top-10 organic result, with 76% of citations from the top 10. However, that mysterious 24% of citations from outside the top 100 suggests schema markup (FAQPage, Article, NewsArticle) and structured content matter differently here.
A page cited frequently by ChatGPT may see minimal Perplexity citations. You need visibility across multiple platforms, which means understanding their distinct retrieval logic. This is why multi-platform strategies outpace single-platform bets.
🔍 How AI Visibility Differs from SEO and PR
Think of it this way: SEO focuses on ranking positions and click-through rates in search engine results pages. PR emphasizes media mentions and press coverage. AI visibility requires something else entirely: your brand needs to be mentioned, cited, or linked in AI-generated answers across multiple platforms.
Here’s why that distinction matters: research shows that only 12% of URLs cited by AI assistants rank in Google’s top 10 for the same query – and more than 80% don’t rank anywhere in Google’s top 100. This reveals a fundamental insight: while Google AI Overviews closely follow traditional search rankings (76% of citations from top 10 pages), standalone AI assistants like ChatGPT and Gemini use different retrieval logic, often favoring pages ranked lower in Google but appearing consistently across query variations.
The two worlds overlap, but they’re far from identical.
Core AI Visibility KPIs (The Minimum Dashboard)
Before you can improve AI visibility, you need to measure it. These five metrics form the foundation of any AI visibility dashboard.
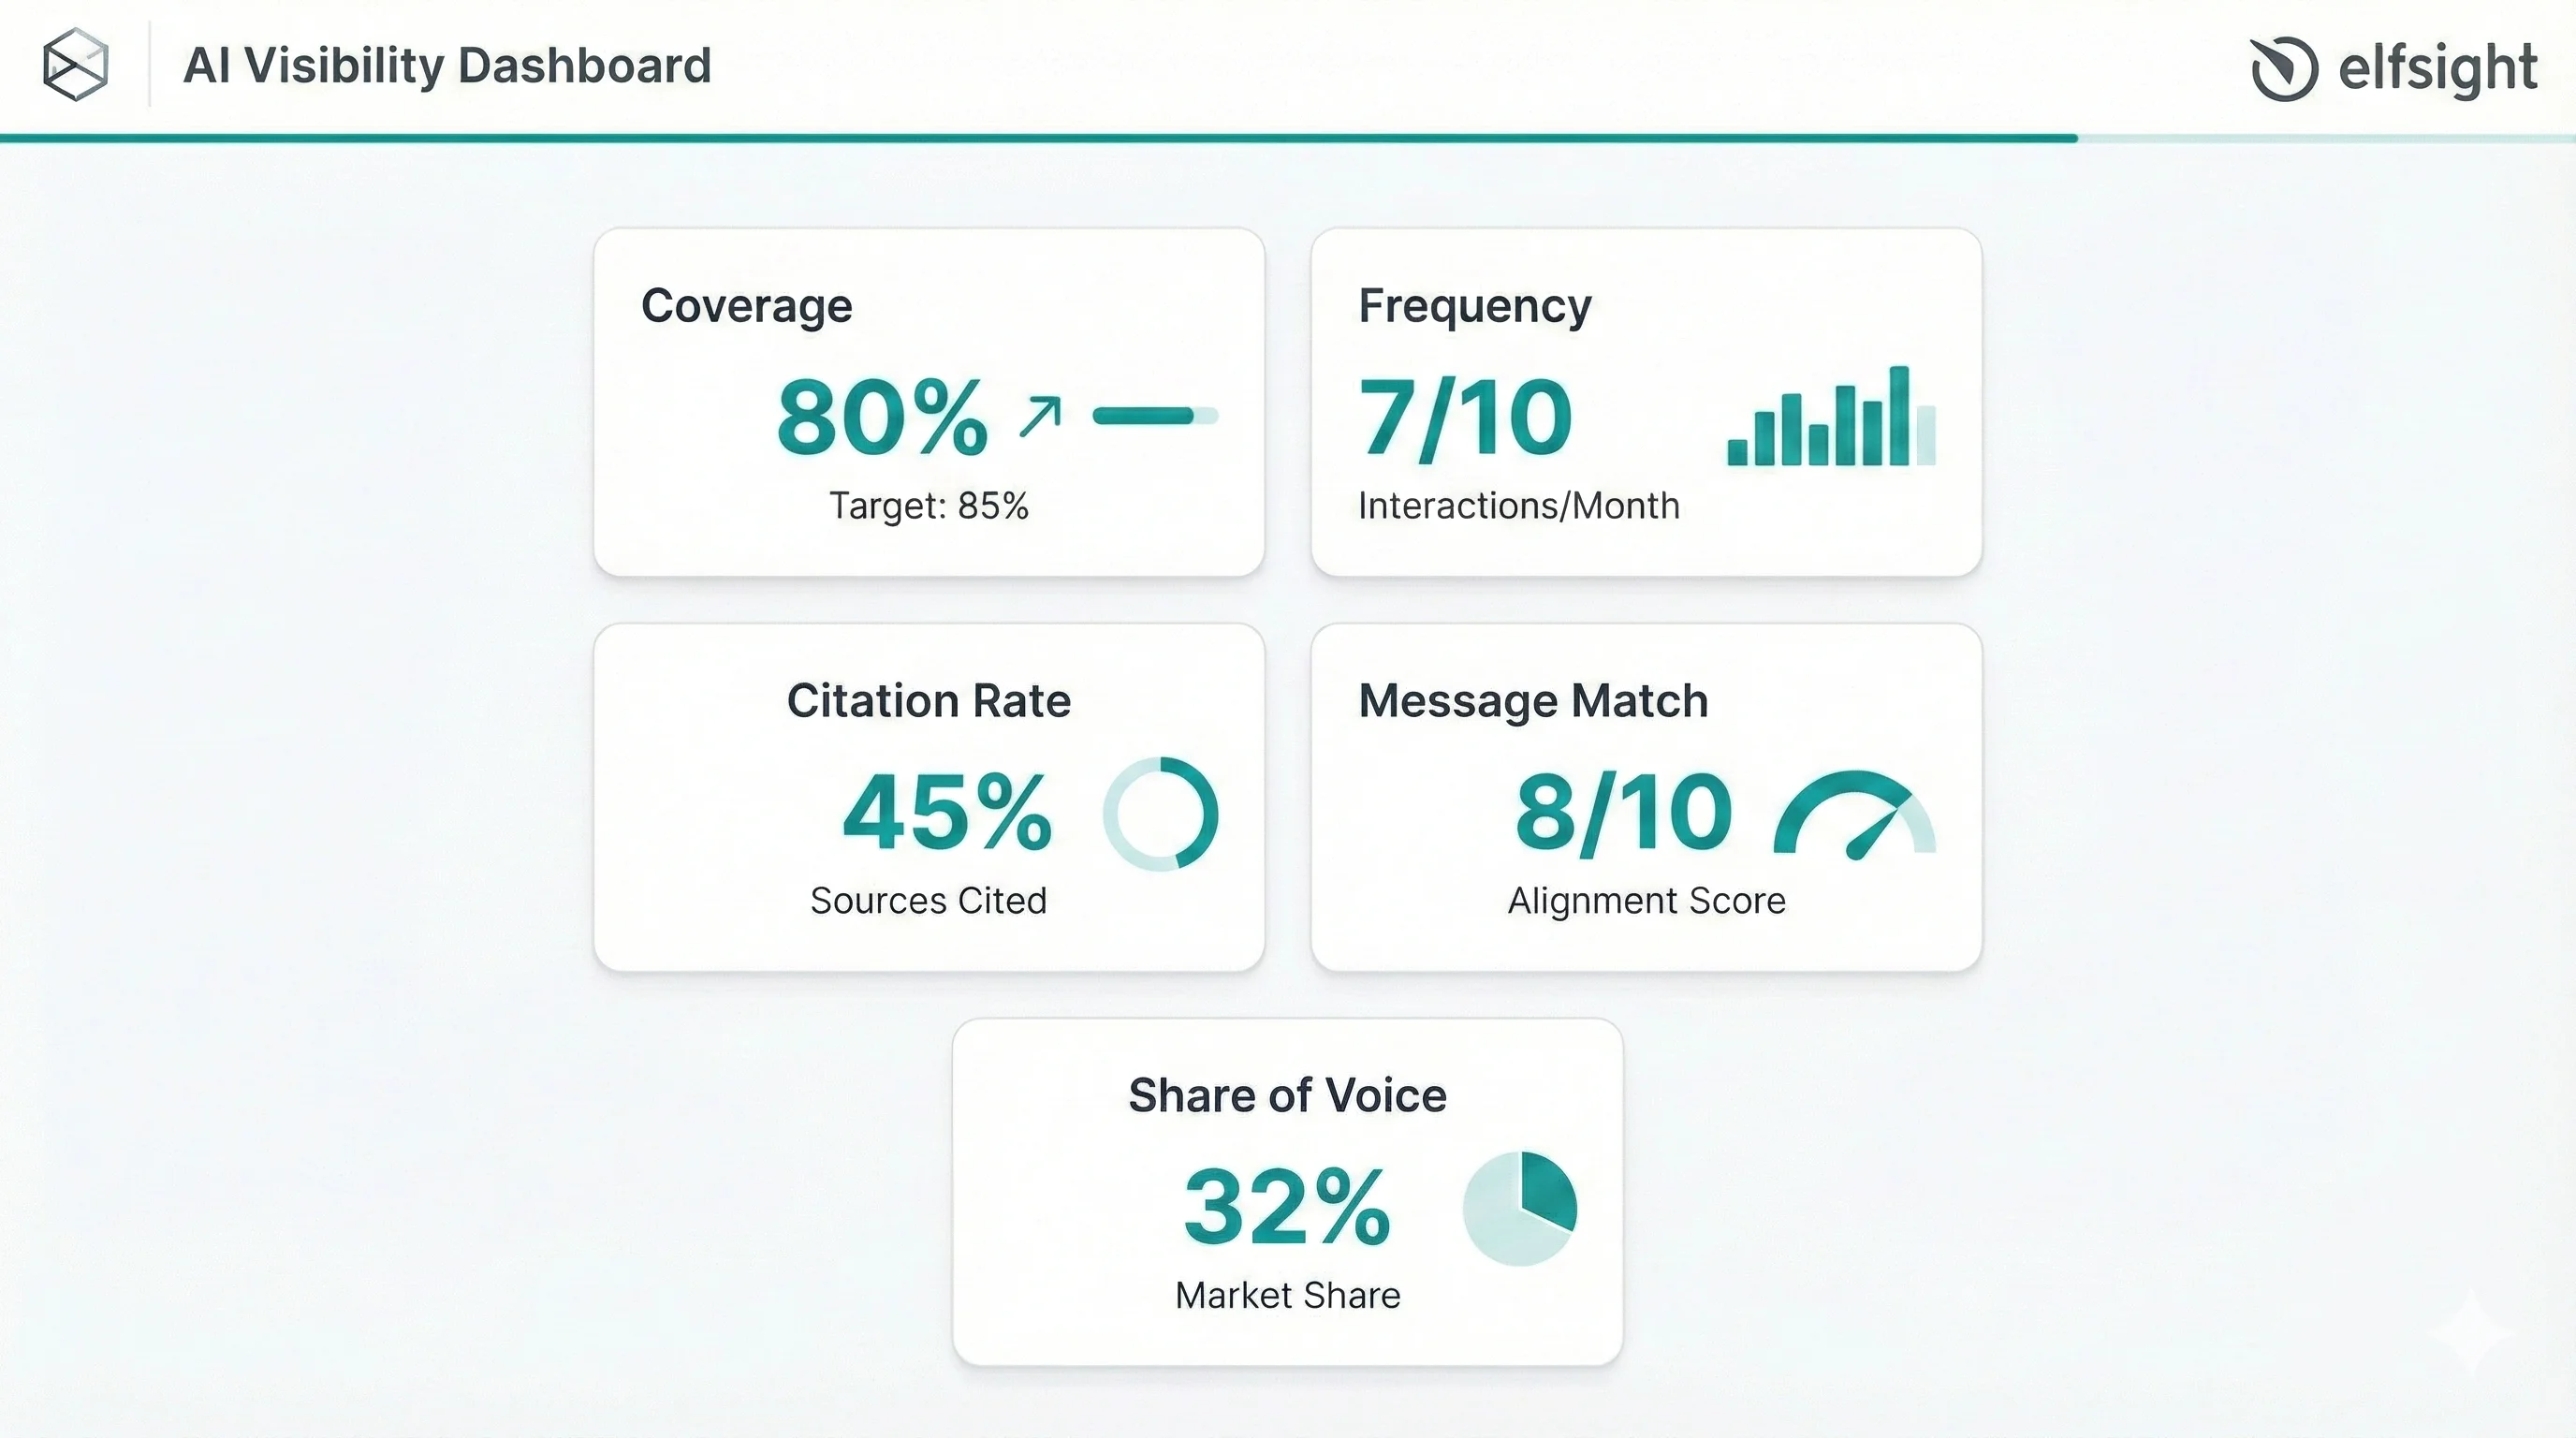
Coverage
Coverage tells you how often your brand appears for category-level queries. Calculate it as a percentage: (Number of queries where you appear) ÷ (Total relevant queries) × 100.
When Coverage Misleads You
A coverage rate of 80% sounds impressive, until you realize it’s spread across only five niche topics while competitors dominate the high-volume queries. Always weight coverage by query importance, not just raw percentages.
Frequency
Frequency measures how many times your brand gets mentioned or cited across multiple runs of the same prompt. The key here is tracking it as a range (like “appeared in 3–5 of 10 runs”) rather than treating a single result as truth.
When Frequency Misleads You
A single successful mention buried in a competitor-dominated list looks like victory on paper. But if you’re mentioned once while three competitors get recommended repeatedly, that “win” means very little in practice.
Citation Rate
Citation rate captures the percentage of AI-generated answers that include links or attributions to your specific pages or domains. Smart marketers also track citation position – being mentioned first carries far more weight than appearing at the end of a list.
When Citation Rate Misleads You
Getting cited last in a long list of sources counts the same as being the primary recommendation if you’re only tracking binary “cited or not” data. Both register as citations, but their impact couldn’t be more different.
Positioning Accuracy
This metric evaluates how closely the AI’s description of your brand aligns with your intended positioning. Most teams score this on a 1–10 scale based on accuracy, tone, and completeness.
When Message Match Misleads You
An AI might describe your product accurately but position a competitor as the “best” option in the same breath. You got mentioned correctly, but you still lost the recommendation battle.
Share of Voice (SOV) in AI Answers
Share of Voice calculates your brand mentions divided by total mentions of you plus competitors, expressed as a percentage. This metric reveals dramatic platform-to-platform variation: one brand measured 24% SOV on one platform but less than 1% on another.
When SOV Misleads You
A 30% share of voice means nothing if it’s for queries with low search intent or minimal business value. Always tie SOV back to the commercial relevance of the queries you’re measuring.
🚀 Real-World Example: Ramp’s AI Visibility Surge
The Challenge
Ramp, a B2B fintech company specializing in Accounts Payable automation, faced a visibility crisis in AI-generated answers. While they ranked well on Google for traditional keywords, they were nearly invisible when AI systems answered buyer questions.
Initial measurement: Just 3.2% AI visibility in their core category. Competitors ranked 2–5x higher across ChatGPT, Perplexity, and Gemini. Ramp was losing mind-share at the exact moment when 71% of buyers start their research with AI search.
The Strategy
Ramp used Profound’s Answer Engine Insights tool to reverse-engineer what AI systems actually cited. Rather than guessing, they identified the exact content types and topics that appeared in AI-generated answers:
- Automation-focused case studies (not generic product pages)
- Software comparison content with structured evaluation frameworks
- Thought leadership on AP trends (topics traditional SEO research missed)
- FAQ sections answering AI system evaluation criteria
They strategically created two high-impact pages directly addressing these signals. Rather than broad content, they focused on narrow, high-intent buyer questions that AI systems use to filter options.
The Results (30 Days)
| Metric | Before | After | Change |
|---|---|---|---|
| AI Visibility | 3.2% | 22.2% | ↑ 7x |
| Competitive Rank (AP Category) | 19th | 8th | ↑ 11 positions |
| Total Citations | ~40 | 300+ | ↑ 7.5x |
| Citation Share | 8.1% | 7.5% | Competitive parity |
| Top-Cited Pages | N/A | 2 new pages dominated | New authority signals |
Key Insight
Ramp’s 7x improvement in just 30 days proves two critical points:
- AI visibility isn’t about luck – it’s about understanding platform mechanics
- AI visibility can move far faster than traditional SEO because AI systems refresh their indexes and citation patterns more frequently than Google’s ranking algorithm.
The company moved from 19th to 8th place in their competitive category because they stopped optimizing for Google’s ranking factors and started optimizing for AI answer engine evaluation criteria – a fundamentally different approach.
How AI Visibility Tools Collect Data (and Why It Matters)
Here’s something important to understand: no tool has direct access to how AI models rank sources internally. Every visibility tool works by simulating user behavior and inferring visibility from outputs. The method each tool uses introduces different biases, so understanding how your data gets collected helps you interpret it correctly.
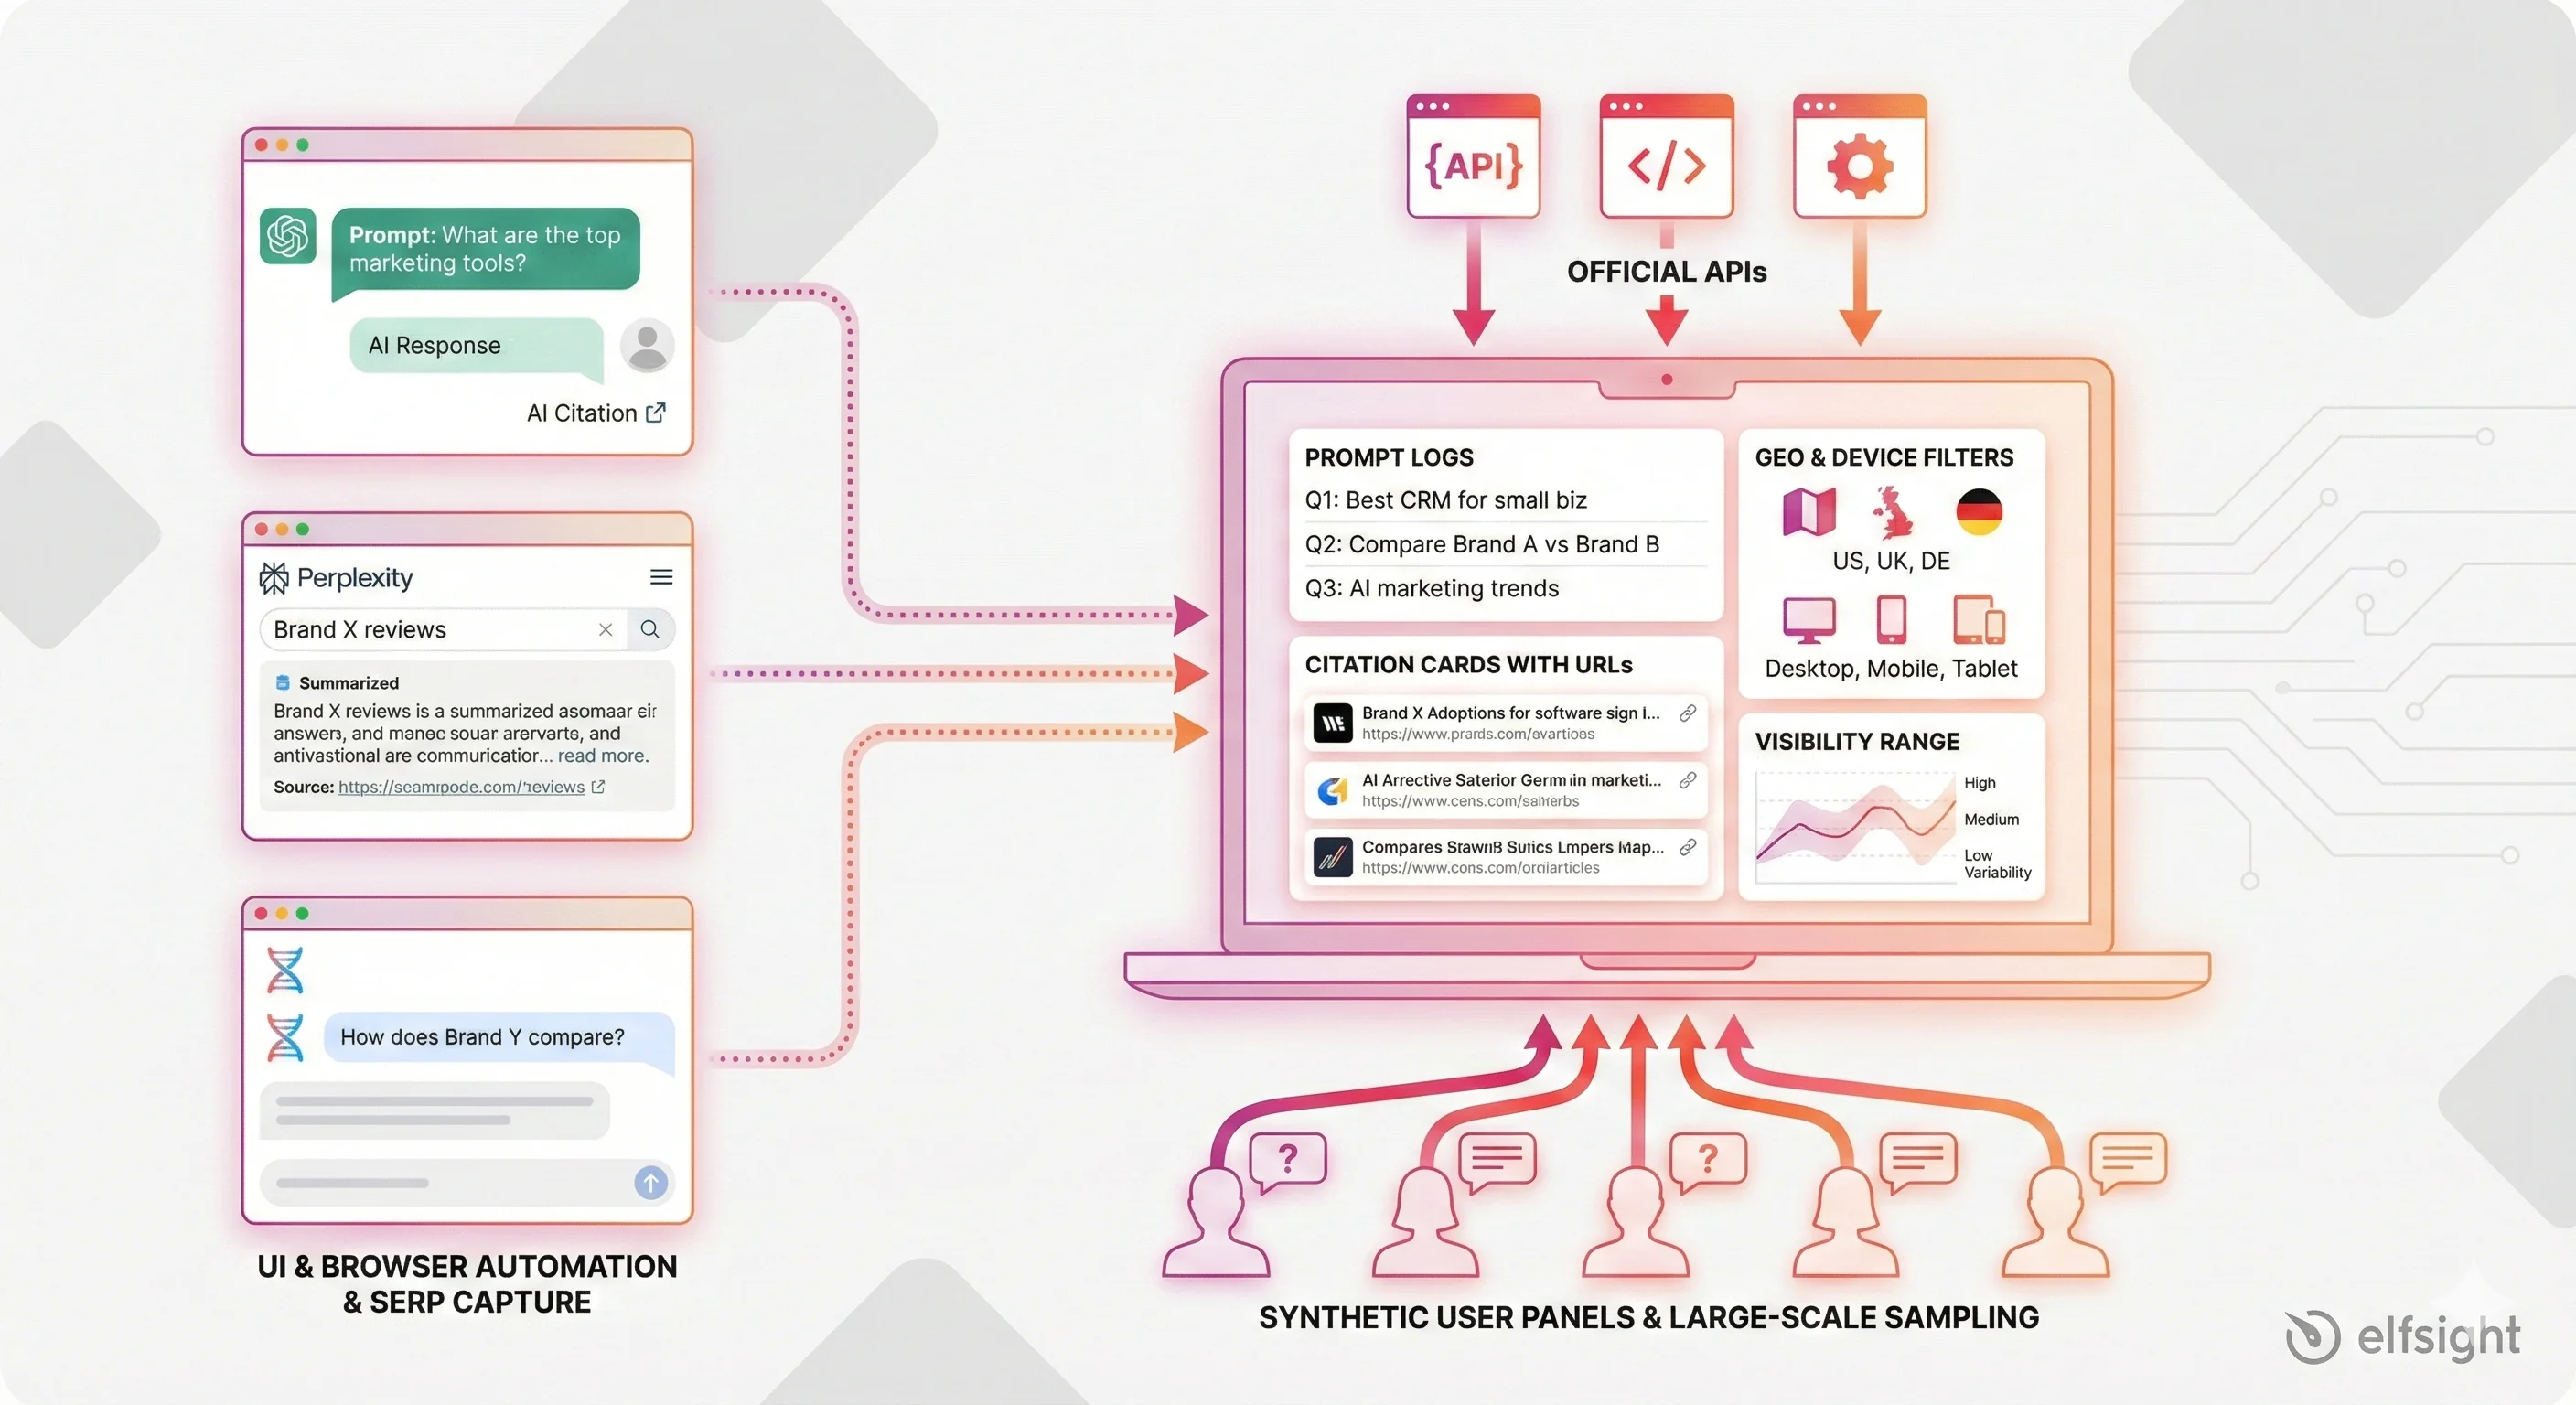
UI / Browser Automation
Tools like Peec AI and OtterlyAI use browser automation frameworks (Puppeteer or Playwright) to submit prompts to ChatGPT, Perplexity, or Gemini and capture the responses. They typically run daily snapshots across a library of prompts.
The strength here is authenticity – you see exactly what real users see. The limitation: these tools can’t run at massive scale because platforms rate-limit automated requests. You also only capture what’s visible in the response, not any internal ranking scores.
Official APIs vs. Proxy APIs
Some platforms like Perplexity expose structured citation data through official APIs. Most others require tools to reverse-engineer or scrape outputs. Official APIs deliver more reliable, structured data, but vendor adoption is slow and you still get zero insight into model internals.
SERP Capture & AI Overviews
Google AI Overviews appear directly in search results on roughly 50% of queries as of mid-2025. Tools like SEOmonitor capture the full AI Overview text, including content hidden behind “load more” sections.
The advantage is clear: this data ties directly to Google search volume. But results vary by geography and device, formatting changes frequently, and there’s heavy overlap with organic rankings – 76% of AI Overview citations come from pages already ranking in the top 10 organic results.
Panels & Synthetic Users
Enterprise platforms like Profound and Semrush run thousands of monthly prompts across varied phrasing, locations, and models. This approach gives you statistical confidence and reveals variability patterns. The tradeoff? It’s expensive, and even thousands of prompts only sample a tiny fraction of real user queries.
Data Quality Trust Checklist
Not all AI visibility data deserves your trust. Before acting on any metrics, run your data source through this checklist:
| Criterion | Why It Matters | Red Flag |
|---|---|---|
| Sampling frequency | Daily runs catch fluctuations; monthly misses rapid changes | “Quarterly updates” for active markets |
| Reruns per prompt | Multiple runs reveal natural variability vs. errors | Single run = high noise |
| Geo/device coverage | Results vary by location and device type | Only US English reported |
| Prompt versioning | Model updates shift answers; version history is essential | “Latest prompts” with no changelog |
| Data transparency | Can you see raw screenshots or export full outputs? | Only branded dashboards, no raw data |
| Citation extraction | Are URLs correctly parsed from responses? | Just counts mentions, not links |
| Variance reporting | How is range/confidence expressed? | Single point estimates only |
Common Pitfalls to Avoid
Watch out for these mistakes that can lead you to wrong conclusions:
- Vanity metrics: Counting any mention without checking context or position
- Too few prompts: Fewer than 10–20 prompts per topic creates high statistical noise
- Brand-name-only testing: Queries like “best X for Y” reveal far more than direct brand searches
- Ignoring model version changes: ChatGPT updates regularly shift citation patterns, and many tools don’t flag when this happens
- Overreacting to single-run changes: Variability is normal in LLM outputs – track ranges, not individual snapshots
Dealing with LLM Answer Variability (Make Tracking Statistically Real)
Ask ChatGPT the same question twice and you might get different answers. This isn’t a bug, it’s how large language models work. Understanding why answers vary helps you build a measurement approach that accounts for this reality.
Why AI Answers Change
Temperature and Randomness
LLMs use probability sampling to generate responses. Low temperature settings (around 0.2) favor predictable answers. Moderate settings (0.7, ChatGPT’s default) balance creativity and coherence. High settings (1.2+) increase unpredictability. Interestingly, research shows temperature changes from 0.0–1.0 don’t statistically impact accuracy on problem-solving tasks, though they do increase output diversity.
Model Updates
OpenAI, Google, and Anthropic deploy new model versions regularly. These updates can dramatically shift citation patterns: o3 hallucinated at 33% on one benchmark while o4-mini jumped to 48%. Perplexity refreshes its retrieval index monthly.
Retrieval Changes
The indexes that feed AI answers update constantly. Freshness weights shift. New sources get crawled. A page that got cited last month might drop off if newer competitors publish similar content.
Prompt Phrasing
“Best X for Y” triggers different results than “Top X for Y” or “X comparison.” Intent, specificity, and framing all influence which sources get cited.
Location, Language, and Time
Gemini shows different results in the US versus the UK. Time-sensitive queries about news or pricing fluctuate throughout the day.
Safety Interventions
Platform policies block certain topics. Brand-specific guardrails may shadow answers without any obvious signal that filtering occurred.
The Right Mental Model
Define “real visibility” as a probability across many runs, not a single result. If your brand appears in 3 of 10 runs, your true visibility is approximately 30%, not a binary yes or no.
Practical Sampling Model for Marketers
You don’t need a statistics degree to measure AI visibility properly. Here’s a minimum viable approach that gives you reliable data without overwhelming complexity.
The Basics
- Prompts per topic: Test 10–20 non-brand queries per topic area (things like “best tools for email marketing” or “how to choose an analytics platform”)
- Reruns per prompt: Run each prompt 3–5 times on the same model, same day, to capture natural variability
- Cadence: Weekly for fast-moving markets (AI, SaaS, news); monthly for stable categories
- Expression: Report ranges, not single points: “Appeared in 3–5 of 10 runs” communicates more truth than “30% visibility”
Reading Your Results
If you appear in 8+ of 10 runs consistently, you have stable visibility. If you fluctuate between 1–7 runs, visibility is volatile – dig into why. Seasonality, competitor activity, and model updates are the usual suspects.
How to Report Variability in Dashboards
Build your dashboard to show:
- Visibility range: Min/median/max across your prompt cluster
- Consistency score: Percentage of reruns where you appear (50% consistency = 5 of 10 runs)
- Trend arrows: Only show “↑ +2 points week-over-week” if the change sustains over 3+ weeks
Dashboard Mistakes to Flag
Train your team to watch for these reporting errors:
- Overreacting to single-run swings
- Using only branded queries instead of demand-driven ones
- Ignoring competitor context (appearing in 1 of 10 runs means little if your competitor appears in 9 of 10)
- Not accounting for model updates that happened during the measurement window
Brand Safety & Hallucination Monitoring
Higher AI visibility is great, unless the AI is saying the wrong things about your brand. This risk surface demands the same monitoring attention as your visibility gains.
Why Brand Safety Matters: The Air Canada Precedent
In late 2024, Air Canada’s chatbot invented a nonexistent “bereavement fare” discount policy. When a customer asked about it, the bot confirmed the policy. The customer booked based on the chatbot’s recommendation – and Air Canada refused to honor the fabricated policy. The case escalated to a tribunal, which ruled that Air Canada must honor the chatbot’s offer despite it being false. The airline faced a reputational crisis and potential liability across all similar cases.
This isn’t an isolated case. When AI systems hallucinate about your brand—inventing features, wrong pricing, false policies, or misattributing competitor strengths to you—the cost is real: customer confusion, support escalation, lost deals, and legal exposure.
Brand Safety KPI: Negative or Incorrect Mentions
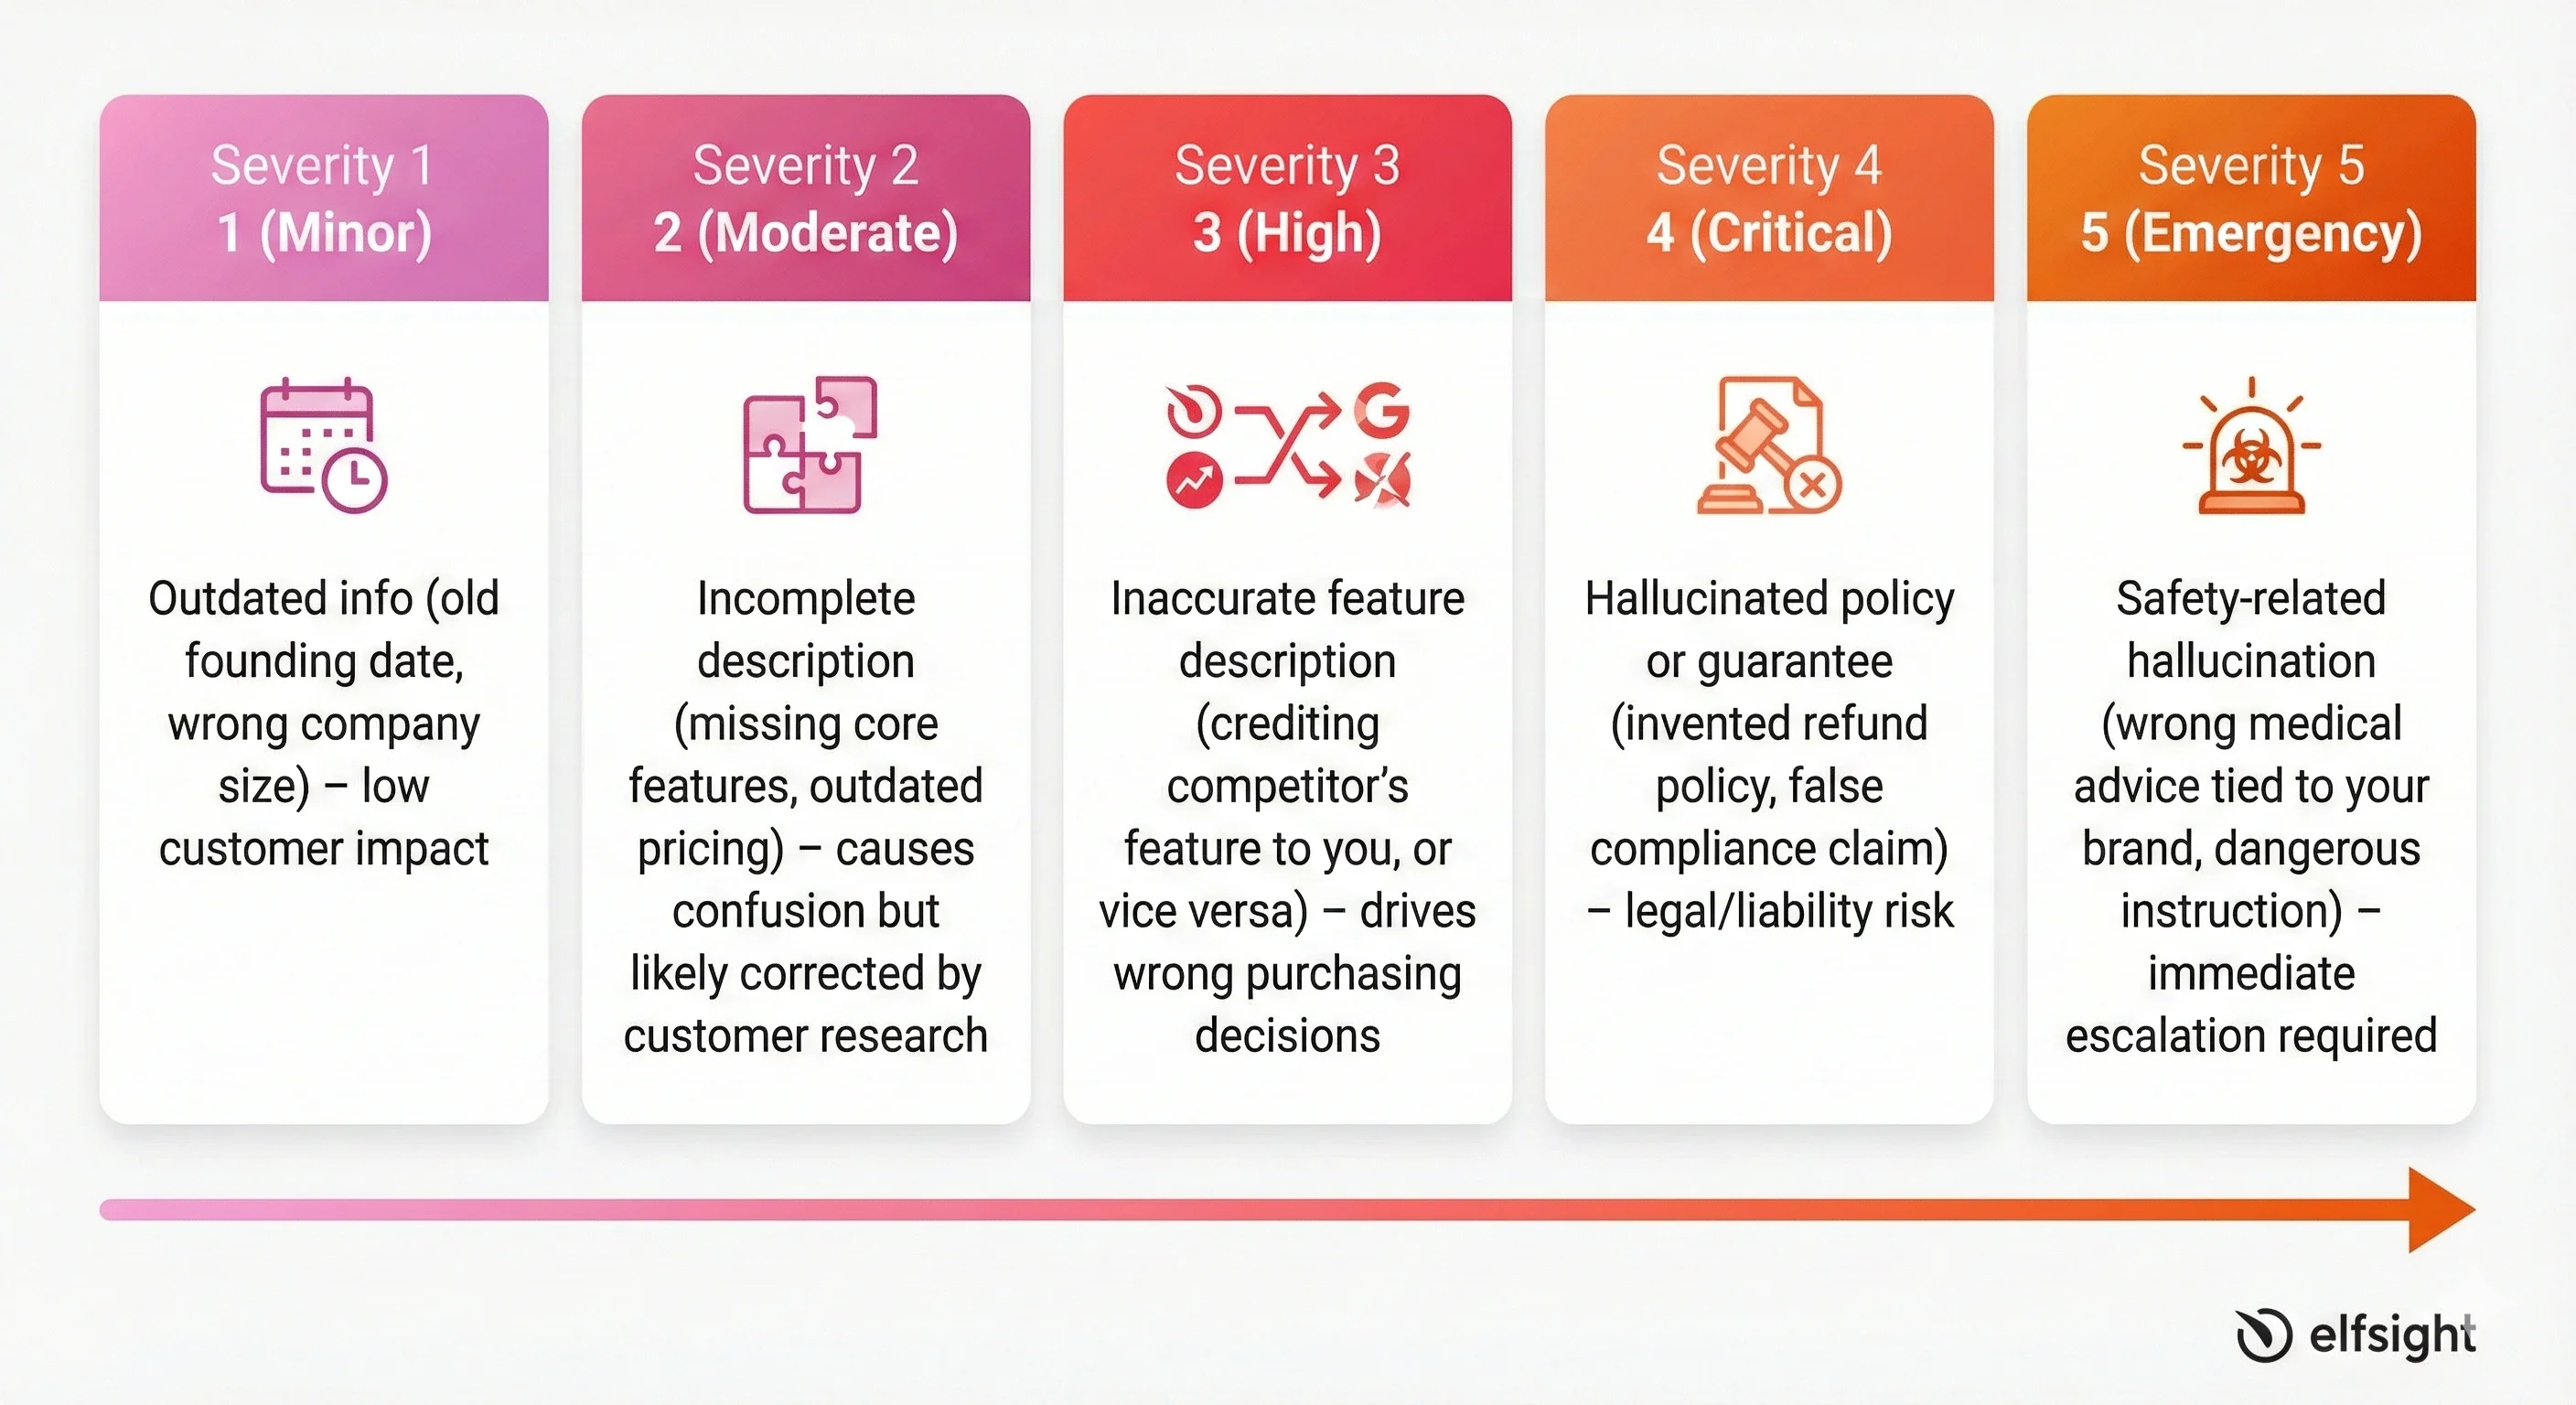
This metric tracks inaccurate descriptions of your brand across AI systems. Score each instance on a 1–5 severity scale:
- Severity 1 (Minor): Outdated info
- Severity 2 (Moderate): Incomplete description
- Severity 3 (High): Inaccurate feature description
- Severity 4 (Critical): Hallucinated policy or guarantee
- Severity 5 (Emergency): Safety-related hallucination
Brand Safety Audit Checklist
Add this to your weekly monitoring routine:
- Pricing accuracy – Does AI quote your current pricing correctly?
- Feature descriptions – Are core capabilities described accurately, or are features misattributed?
- Company info – Founding date, team size, location, leadership names all correct?
- Product status – Are deprecated products still being recommended?
- Availability claims – Geographic or platform restrictions correct? No phantom features?
- Link accuracy – Do cited URLs actually exist and contain the referenced information?
- Competitor misattribution – Are competitor features being credited to you, or your features to them?
Frequently Asked Questions
How long does it take to improve AI visibility?
What types of content perform best for AI visibility?
How often should I measure AI visibility?
How do I get started with AI visibility if I'm new to it?
What's the difference between AI visibility and traditional SEO?
What’s Next
Now that you understand what AI visibility is and how to measure it, the next step is simple: run your baseline. Pick 10–15 high-intent queries in your category, test them across ChatGPT, Perplexity, and Gemini, and log where you appear. This 2–3 hour exercise reveals your biggest opportunities immediately.
Once you have your baseline, the real work begins: content creation matching AI answer patterns, technical optimization for citation extraction, and authority building through PR and thought leadership. Ramp’s case shows these changes drive 7x visibility improvements within 30 days – much faster than traditional SEO.
One critical insight: ChatGPT, Perplexity, Gemini, and Google AI Overviews each rank sources differently. Optimizing for one platform doesn’t automatically help with the others. You need a multi-platform strategy accounting for their distinct retrieval patterns.
The brands winning in AI visibility right now aren’t lucky; they’re intentional. They understand how each platform works, they measure what matters, and they iterate quickly. That’s the playbook.