Most businesses get the deployment part right. They pick a chatbot, train it on some content, embed it on their website, and move on. The part that usually falls off is everything after that: the measurement, the review, the iteration. Without a clear set of chatbot KPIs, the bot sits on your site doing something, but whether that something is helping or quietly driving visitors away is anyone’s guess.
This guide is built around a practical question: how to measure chatbot success when you don’t have a data team, an enterprise analytics platform, or hours to spend on dashboards. The framework covers the metrics that matter, realistic benchmarks grounded in actual research, and a straightforward ROI calculation you can run with the tools you already have.
- A three-category framework for chatbot success metrics
- Sourced benchmarks for each KPI, adjusted for SMBs (not enterprise)
- A step-by-step AI chatbot ROI calculation with a real example
- Why knowledge base quality is the single variable that shapes every other metric
- What to track first when your chatbot has limited built-in analytics
Why Most Chatbots Underperform (and How to Find Out if Yours Does)
“While 73% of customers use self-service at some point in their customer service journey, it’s concerning to see that so few fully resolve there.” — Eric Keller, Gartner Customer Service & Support Practice
Most businesses assume a chatbot is working unless they hear complaints. The problem is that most unhappy users don’t complain – they leave. A Five9 survey found that about 2 in 5 consumers would stop doing business with a company after a single bad service experience. No angry email, no support ticket –just gone.
The gap between usage and resolution is where chatbots quietly fail. Gartner’s research found that 9 in 10 customer journeys that start in self-service end up requiring another channel. The most common reason? 43% of customers couldn’t find content relevant to their issue. The chatbot was technically available, but the answers it needed weren’t in its training data.
Sentiment reflects this tension, too: only 51% of customers say they’d be willing to use a GenAI assistant for service. The businesses that earn that missing trust are the ones that measure, identify gaps, and fix them. High-maturity companies track AI-driven metrics at roughly 3x the rate of low-maturity peers (66% vs. 21%). The difference isn’t better AI – it’s knowing what’s happening in conversations and fixing the gaps.
The Three Types of Chatbot KPIs
Chatbot success metrics fall into three categories, each answering a different question about your AI chatbot’s performance:
| Category | What It Measures | Key Metrics |
|---|---|---|
| Efficiency | Is the bot handling conversations mechanically? | Containment rate, fallback rate, average handling time |
| Customer Experience | Are visitors getting helpful, satisfying answers? | CSAT, return visitor rate, conversation depth |
| Business Impact | Is the bot contributing to revenue or reducing costs? | Leads captured, ticket deflection, conversion rate |
These categories build on each other. A chatbot with a high containment rate but low CSAT is deflecting questions without actually solving them – that’s a frustration loop, not efficiency. A chatbot with great satisfaction scores but no measurable impact on leads or support workload might be pleasant but unproductive.
The most useful picture comes from tracking at least one metric in each category, which gives you both the “what’s happening” and the “so what” in a single view.
Efficiency Metrics: Is the Bot Doing Its Job?
Before worrying about satisfaction or ROI, you need to know whether the chatbot is actually handling conversations and how often it falls short.
Containment Rate
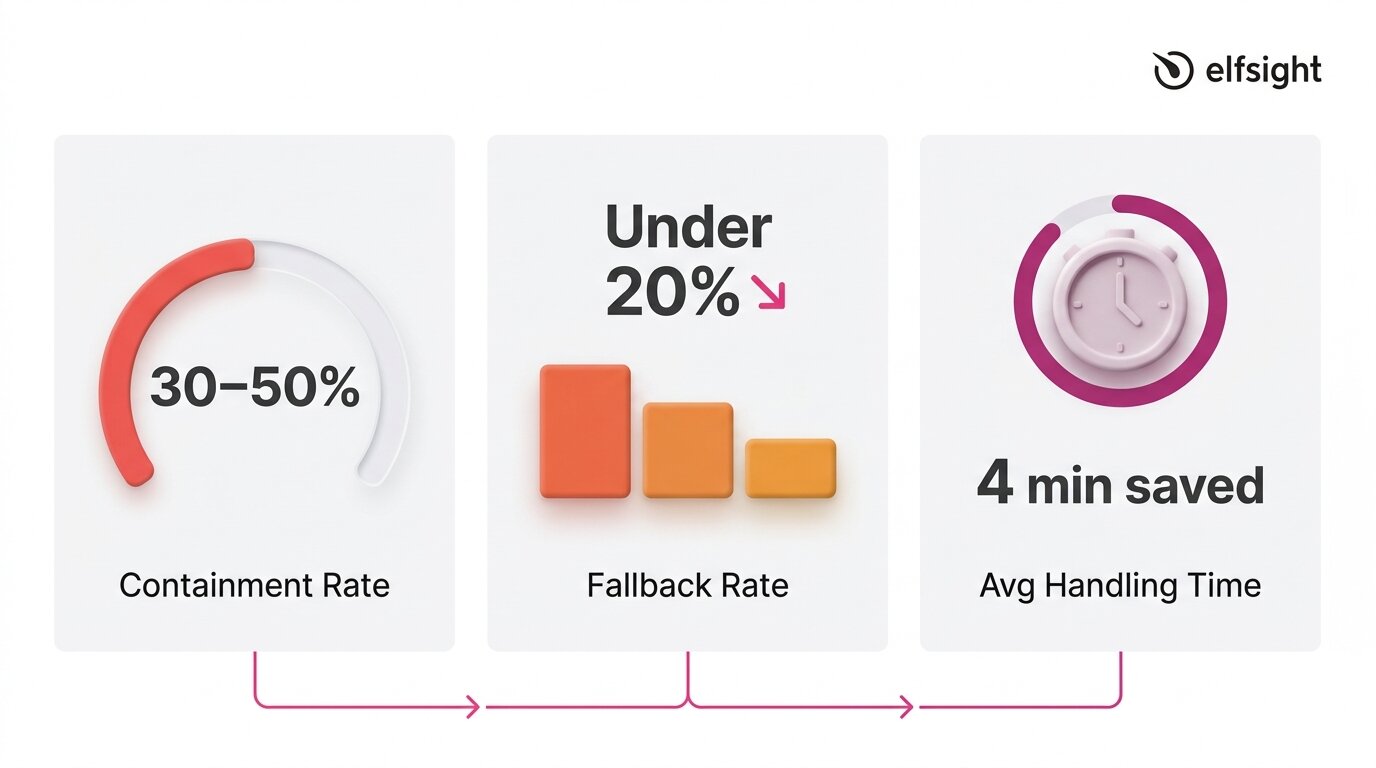
Containment (automation) rate measures the share of conversations a chatbot resolves without human escalation. It’s the most widely used KPI because it directly shows how much workload the bot absorbs. A conversation is “contained” when the visitor gets an answer and doesn’t need to reach a human through another channel.
Benchmarks for this metric vary widely depending on what you’re measuring and who’s doing the measuring. Some sources suggest companies using AI chatbots resolve 30–50% of Tier 1 tickets automatically, which is a realistic initial target for SMBs deploying a knowledge-base chatbot.
Enterprise-grade deployments with dedicated optimization teams sometimes report higher numbers (70% and above), but those figures reflect significant investment in training data, workflow design, and ongoing tuning.
Fallback Rate
Fallback rate measures how often a chatbot fails to understand or answer a query, when it replies with something generic like “I’m not sure I understand” or redirects without resolving the question. A high fallback rate is a clear sign of gaps in training data, and it aligns with Gartner findings that 43% of self-service failures stem from missing or irrelevant content.
This metric is especially useful because it’s diagnostic. Every fallback response points to a specific gap:
- A topic the knowledge base doesn’t cover,
- A question phrased in a way the bot doesn’t recognize,
- Or a product detail that was never included in the training content.
Tracking fallback patterns over time turns your chatbot from a static tool into one that improves with each review cycle.
Average Handling Time
Average handling time tracks how long a chatbot conversation takes from the first message to resolution. Shorter isn’t always better: a three-message exchange that solves a complex issue is more valuable than a quick dead end. Over time, this metric shows whether your chatbot is becoming more efficient as its knowledge base improves.
Research backs the impact: Juniper Research estimates chatbots save about four minutes per enquiry compared to human support, while HubSpot’s State of Service report finds teams using AI chatbots save an average of 2 hours and 20 minutes per day.
If your chatbot tool doesn’t surface handling time directly, you can estimate it by reviewing transcripts: note the timestamp of the first visitor message and the last bot response in each conversation, then average across a sample of 20–30 interactions.
Customer Experience Metrics: Are Visitors Satisfied?
A chatbot can handle high volume and still frustrate users. Experience metrics capture whether it feels helpful, builds trust, and meets expectations. They matter because success isn’t just throughput – it’s whether the interaction encourages people to engage with your business.
Customer Satisfaction Score (CSAT)
CSAT is the most direct measure of visitor satisfaction. It’s typically collected via a post-chat prompt – a thumbs-up/down, a star rating, or a short survey, and expressed as a percentage of positive responses.
The American Customer Satisfaction Index reported a national average of 76.9 out of 100 in 2025, which serves as a broad benchmark. For chatbot interactions specifically, aggregated data indicates that around 80% of users who interacted with AI chatbots report a positive experience, while SaaS and e-commerce benchmarks hover around 78–80%.
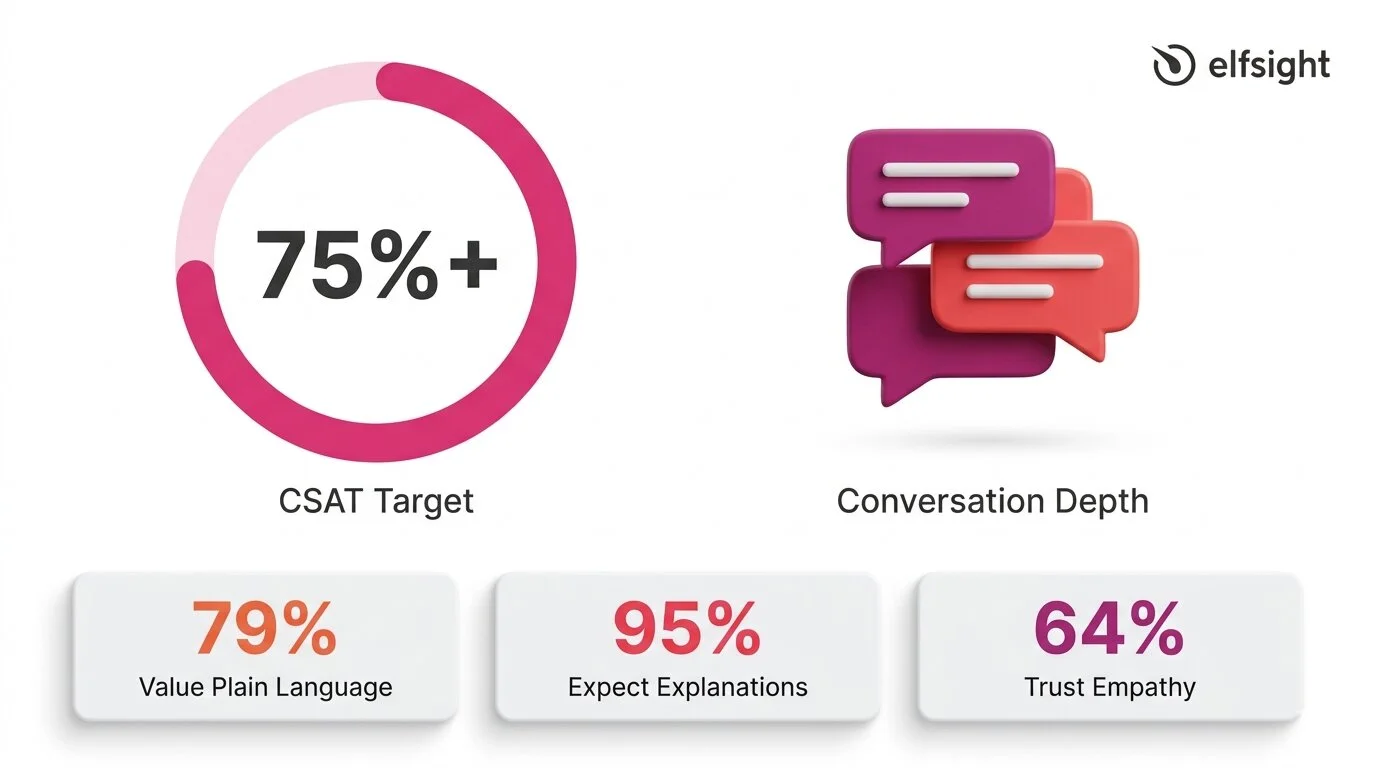
A reasonable target for an SMB chatbot is 75%+ CSAT, with 80%+ indicating strong performance. For context, a Zendesk case study on Vagaro reported 92% CSAT, 44% automated resolution, and an 87% reduction in resolution time – an enterprise example, but a useful benchmark when the knowledge base and setup are strong.
Consumer expectations add an important layer to this metric:
- 79% of consumers value plain-language reasoning in AI
- 95% expect explanations for AI decisions
- 64% trust AI more when it shows empathy
CSAT doesn’t just reflect answer accuracy: it reflects tone, clarity, and whether the visitor felt understood.
Return Visitor Rate and Conversation Depth
CSAT tells you whether a single interaction was satisfying. Return visitor rate and conversation depth indicate whether visitors trust the chatbot enough to return and engage in longer, multi-turn conversations. These are secondary indicators, but they’re valuable signals, especially when your chatbot doesn’t have a built-in survey mechanism.
The Zendesk CX Trends 2026 report highlights why continuity matters: 81% of consumers want agents to be able to continue conversations without backtracking, and 74% are frustrated when they have to repeat information.
If your chatbot maintains context across messages and visitors return with follow-up questions instead of switching to email or phone, that’s a strong signal of trust. Track it by reviewing transcripts for returning visitors and noting the average number of messages per conversation over time.
Business Impact Metrics: Is It Worth the Investment?
Efficiency and experience metrics show whether the chatbot is working. Business impact metrics show whether it’s worth it. For most SMBs, this comes down to three questions: is the bot generating leads, is it reducing the support workload, and is it contributing to conversions?
Leads Captured
The simplest business impact metric is the count of contact form submissions collected through the chatbot. If the bot has a built-in form that captures names, emails, or phone numbers during conversations, every submission is a measurable lead that wouldn’t have existed without the chatbot interaction.
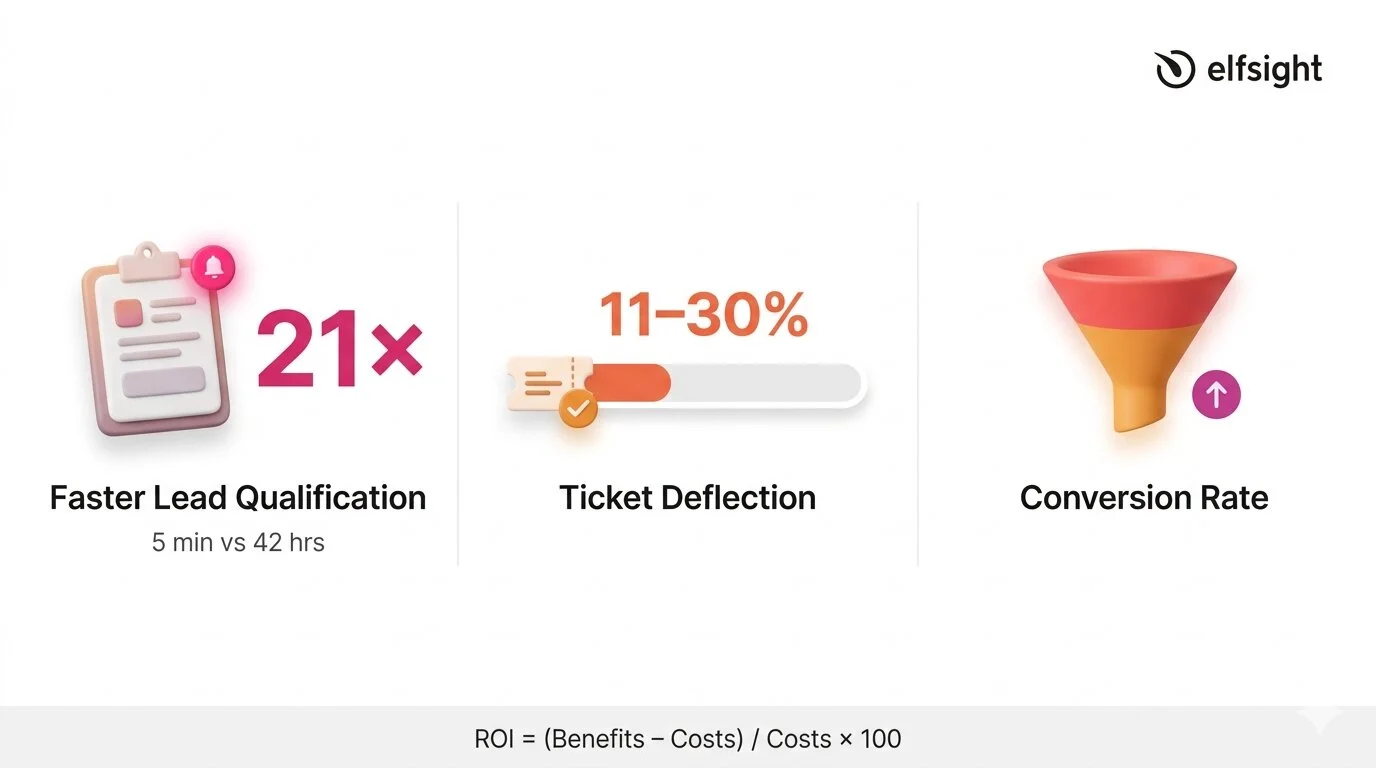
What makes this metric especially powerful is the speed advantage. A widely cited Harvard Business Review / MIT study on lead response times found that companies responding within 5 minutes were 21 times more likely to qualify the lead than those that waited 30 minutes. According to HubSpot, the average B2B lead response time is 42 hours. A chatbot responds in seconds. That gap between 42 hours and instant is where the lead generation value of a chatbot becomes hard to argue with, even if the bot does nothing else.
Ticket Deflection
Ticket deflection measures how much of the human support workload the chatbot absorbs. Every conversation the bot resolves is one fewer email, phone call, or support ticket your team has to handle. As per HubSpot’s report, AI resolves 11–30% of support volume for teams that have adopted it, and 86% of service leaders reported that AI positively impacted their CSAT scores.
Even when the chatbot can’t fully resolve an issue, partial containment still saves time. Capturing basic information upfront, such as the customer’s name, the nature of their issue, and relevant account details, reduces the subsequent interaction time by up to one-third. A chatbot that gathers context before handing off to a human is still deflecting work, even if the conversation doesn’t end in the chat window. This is an important nuance for understanding the real cost picture of a chatbot investment.
Conversion Rate
Conversion rate tracks whether chatbot interactions lead to a desired outcome – a sale, a booking, a form completion, or another goal your website is optimized for. This is the hardest metric to measure for SMBs without attribution tracking, because isolating the chatbot’s contribution from other factors (page design, traffic source, pricing) requires more analytics infrastructure than most small businesses have.
A practical workaround is to compare conversion rates on pages where the chatbot is active versus pages where it isn’t, or to track form submissions that originate from within the chat versus from standalone page forms. Neither method is perfectly controlled, but both give you a directional signal, and a directional signal is far more useful than no signal at all.
How to Calculate AI Chatbot ROI
The challenge isn’t the math. It’s about plugging in realistic numbers rather than inflated marketing figures. The standard formula for AI chatbot ROI is straightforward:
ROI = [(Total Benefits − Total Costs) / Total Costs] × 100On the benefits side, three inputs matter most:
- Support time saved — multiply the number of conversations the bot resolves monthly by the average time each would have taken a human, then multiply by your hourly support cost.
- Leads captured — multiply the number of chatbot-generated leads by your average lead value (or estimated close rate × average deal size).
- After-hours availability — if the chatbot handles conversations outside business hours that would otherwise go unanswered, estimate the value of those interactions based on lead capture or support deflection during those windows.
On the cost side, include the chatbot subscription fee plus the time your team spends maintaining the knowledge base each month. If you’re spending 2 hours per month on transcript review and KB updates at $25/hour, that’s $50 in maintenance labor to add to the subscription cost.
Worked Example
Suppose you’re on a chatbot plan that costs $10–$20/month. Your bot handles 200 conversations per month and resolves 30% without escalation – that’s 60 contained conversations.
If each would have taken a team member five minutes, that’s 5 hours of support time saved. At $25/hour, that’s $125/month in labor savings alone – already a clear return on a $10–$20 subscription, before counting lead capture or after-hours value.
Modern AI-powered chatbots may have different cost profiles depending on model usage and pricing structure, but the order-of-magnitude difference between chatbot and human costs holds consistently across sources ($0.01–0.70 vs ~$5–15+).
The Variable That Determines Every Metric
“Service and support leaders are eager to deploy conversational GenAI, but they cannot ignore existing issues with knowledge management.” — Kim Hedlin, Gartner Customer Service & Support Practice
Every metric covered above: containment rate, CSAT, fallback rate, lead capture, even ROI, traces back to one variable: the quality of your chatbot’s knowledge base. A chatbot with a comprehensive, well-structured, and up-to-date knowledge base will perform well by default. One with thin, outdated, or conflicting content will produce poor results, no matter how advanced the underlying AI model is.
The research underscores this forcefully: a Gartner survey of 187 customer service leaders found that 61% have a backlog of knowledge articles to edit, and more than one-third have no formal process for revising outdated content. Recall the finding from earlier: 43% of self-service failures trace back to missing or irrelevant content. The knowledge base isn’t a secondary consideration – it’s the primary one.
For SMBs, this is actually encouraging. You don’t need better AI, a more expensive plan, or a dedicated analytics team to improve chatbot performance. You need a well-maintained knowledge base that covers the questions your visitors actually ask.
What Chatbot Success Looks Like in Practice
With the metrics defined, here’s a consolidated view of realistic targets – based on cited research and adjusted for SMBs running knowledge-base chatbots on their websites:
| Metric | Realistic SMB Target | Strong Performance |
|---|---|---|
| Containment rate | 30–50% | 50%+ |
| CSAT | 75%+ | 80%+ |
| Fallback rate | Under 20% | Under 10% |
| Lead response time | Under 1 minute | Instant (seconds) |
| Ticket deflection | 10–30% | 30%+ |
Looking ahead, these targets will shift. Agentic AI is projected to autonomously resolve 80% of common customer service issues by 2029, though the same analysis notes that 2026 remains a foundation-building year, with realistic autonomous resolution targets of 40–50%. The businesses measuring today are building the baseline that makes future optimization possible.
Chatbot KPIs: Common Questions
How to measure effectiveness of a chatbot?
What is a good chatbot automation rate?
How do you calculate chatbot ROI?
What CSAT score should a chatbot achieve?
Why is my chatbot not performing well?
How often should I review chatbot performance?
Where to Start
The 14% resolution rate that opened this article isn’t a reason to avoid chatbots – it’s a reason to measure their success (or failure). Most businesses deploy a chatbot and never check if it’s actually resolving issues, capturing leads, or meeting expectations.
Pick one metric from each of the three categories and track them for a month:
- Efficiency — count contained conversations vs. those requiring human follow-up
- Experience — enable response ratings or add a post-chat satisfaction prompt.
- Business impact — track chatbot-generated form submissions as your lead capture count.
Then review your fallback patterns, update your knowledge base for the most common gaps, and measure again. That cycle is the system that turns a chatbot from a set-it-and-forget-it widget into a tool that compounds in value every month.
Primary sources
- Gartner, “Only 14% of Customer Service Issues Are Fully Resolved in Self-Service” – https://www.gartner.com/en/newsroom/press-releases/2024-08-19-gartner-survey-finds-only-14-percent-of-customer-service-issues-are-fully-resolved-in-self-service
- Zendesk CX Trends 2026 – https://www.zendesk.com/newsroom/press-releases/contextual-intelligence-becomes-the-new-standard-for-exceptional-customer-experience-in-2026/
- HubSpot State of Service 2024 – https://www.hubspot.com/hubfs/2024%20HubSpot%20State%20of%20Service.pdf
- Juniper Research, Chatbot Cost Savings – https://www.juniperresearch.com/press/chatbots-a-game-changer-for-banking-healthcare/
- American Customer Satisfaction Index, Q4 2025 – https://unthread.io/blog/customer-satisfaction-score-statistics/
- Fullview, CSAT by Support Channel Statistics 2026 – https://unthread.io/blog/customer-satisfaction-score-statistics/